Let us continue with the benchmark results.
SATA2 drives are currently tested with an ASRock M3A790GXH/128M motherboard and SATA3 drives are currently tested with an ASRock 890GX Extreme3 motherboard.
At present, Microsoft Windows 7 Ultimate Edition is used as the operating system.
The SSD drive speed was examined and compared with the following benchmark software:
AS SSD Benchmark 1.4.3704.27281 – Download
ATTO Disk Benchmark v2.46 – Download
CrystalDiskMark 3.00 – Download
HD Tach 3.040 – Download
SiSoftware Sandra 2010c – Download
The SSD benchmark values offers a very good reference point of the maximal possible reading and writing performance, the speed with smaller files and the respective access time.
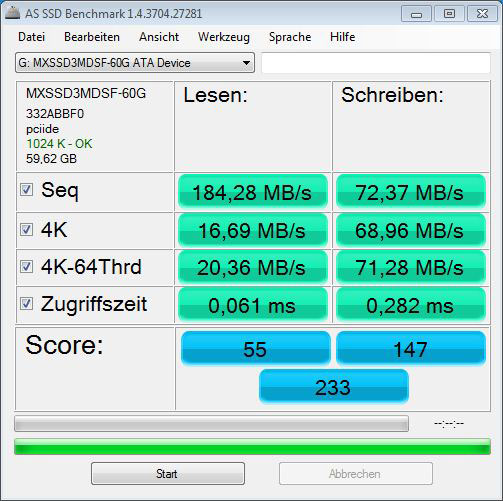
In IDE mode the SSD reached like the previously tested SSDs a much slower performance.
The maximum transfer rate of the Serial ATA 2.0 interface was not exceeded with approximately 184,28 MB/s, so that a SATA3 interface would not be necessary for this benchmark.
The write performance in IDE mode reached slow 72,37 MB/s.
In IDE mode the overall score reached 233 points, in comparison to this value for example the OCZ Agility 120GB SATA2 SSD reached 138 points, ADATA S511 120GB reached 311 points, the 256GB m4 SSD reached 291 points and a 256GB C300 SSD reached 290 points.
Here is a Snipping screenshot of the AS SSD benchmark results (SATA3 IDE):
In AHCI mode also another result beneath the read performance was much higher than in the IDE mode and that is the important value “4K-64Thrd”.
4K means that small 4K blocks are read and/or written and with the 4K 64Thrd this is distributed on 64 Threads at the same time.
Thus the benchmark program simulate for example a typical program start.
Since the weighting of this value is very high in the AS-SSD benchmark tool,the total score in AHCI mode is with 268 points much higher than the previous one in IDE mode.
In AHCI mode the Mach Xtreme Technology MX-DS Fusion 60GB reached a read performance of 198,90 MB/s and a write performace of 73,24 MB/s which is almost identical to the legacy IDE result.
Hint:
Who think now about changing its SATA port in the BIOS from native IDE and/or legacy IDE to AHCI, should change first for example (if possible) only one part of the SATA port, where the drive with the operating system is not installed.
Because if one like to save the new Windows installation, one must install the hard disk controller driver before changing SATA mode from IDE to AHCI – alternatively there are also Registry entries for it.
If you like to upgrade from HDD to SSD, you should not copy the content 1:1 only with a tool like Norton Ghost or Acronis Backup.
It is better to install a fresh Windows7 or adjust at least the SSD Alignment.
We help you with questions to this topic or all other PC related questions at any time 24/7 in our PC Forum.
Here is a Snipping screenshot of the AS SSD benchmark results (SATA3 AHCI):

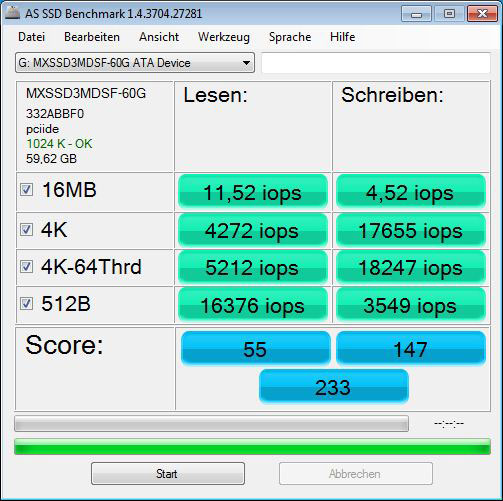
Here is a Snipping screenshot of the AS SSD iops results to measure the input/output speed (SATA3):
And here is a Snipping screenshot of the AS SSD iops AHCI results to measure the input/output speed, with a drastic rise of the 4K-64Thrd read performance (SATA3 AHCI):

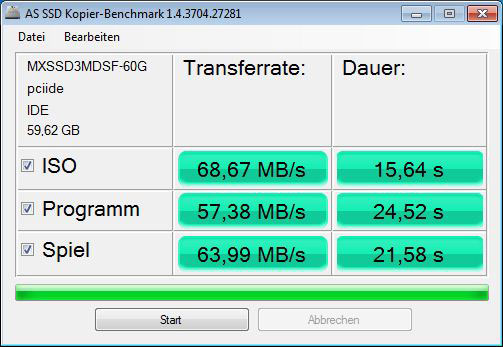
In order to get an impression of the speed, here is another Snipping screenshot of the AS SSD copy benchmark (SATA3):
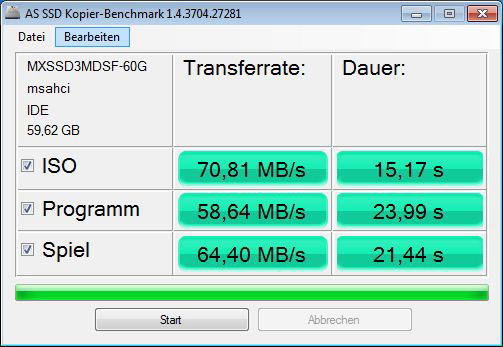
The AS SSD copy benchmark values of this SSD are only a little bit faster in AHCI mode (SATA3 in AHCI mode):
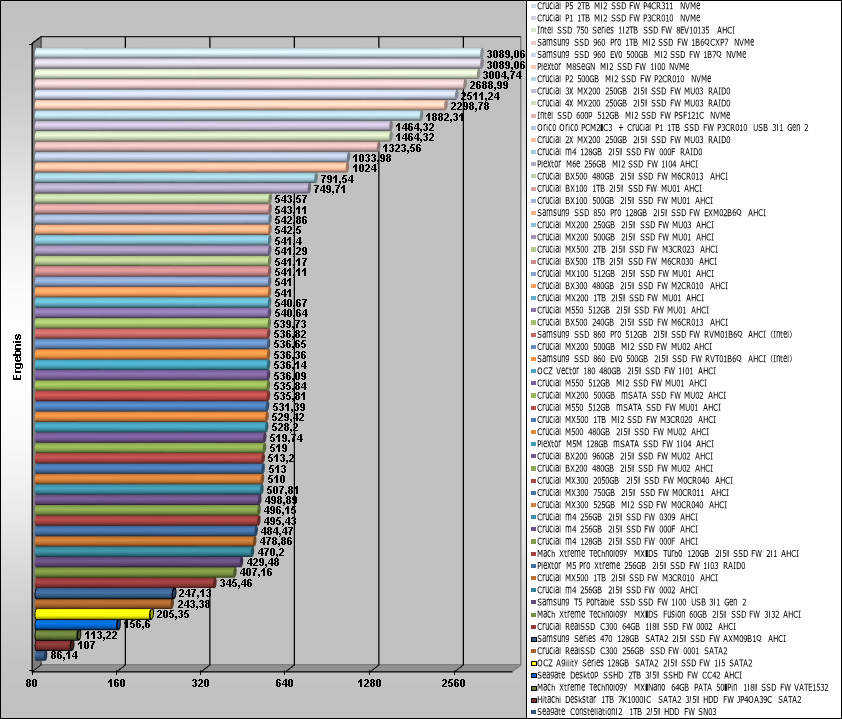
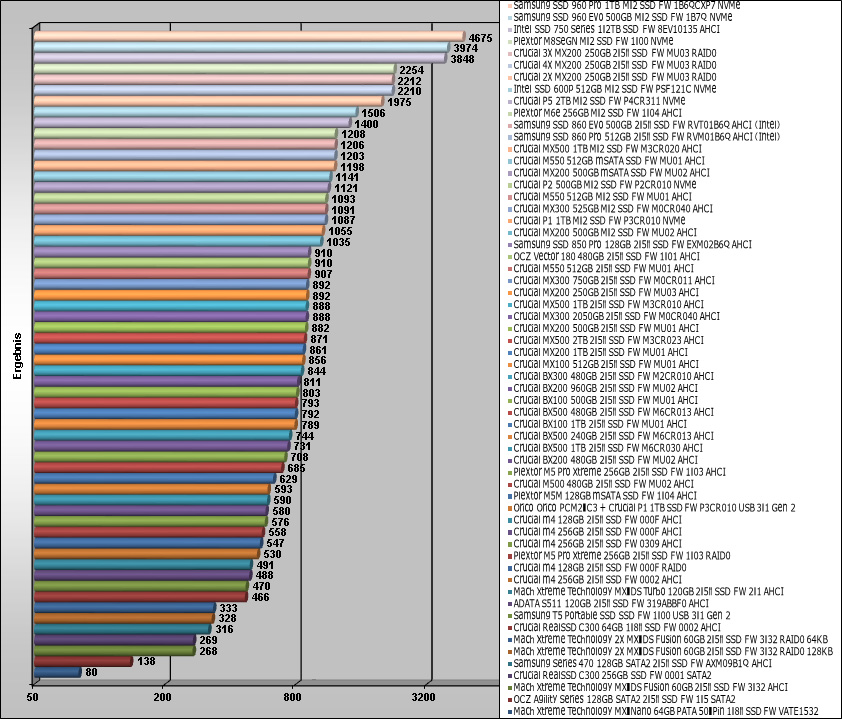
The comparison of the AS SSD benchmark results is extended with each new HDD/SSD test.
Here we see several SSDs in comparison to the Mach Xtreme Technology MX-DS Fusion 60GB 2.5″ SSD in IDE and in AHCI mode, whereby the diagram is updated shortly with new SSDs.
Currently, the Crucial m4 256GB SSD is at the to of all result, which offered the highest sequential write performance.
Directly followed by the Mach Xtreme Technology MX-DS Turbo 120GB SSD and the similarly build ADATA S511 120GB SSD.
The Mach Xtreme Technology MX-DS Fusion 60GB SSD can be found in the lower half of all tested SSDs.
Here is a comparison of the AS SSD benchmark values, which are getting updated with soon coming drives:
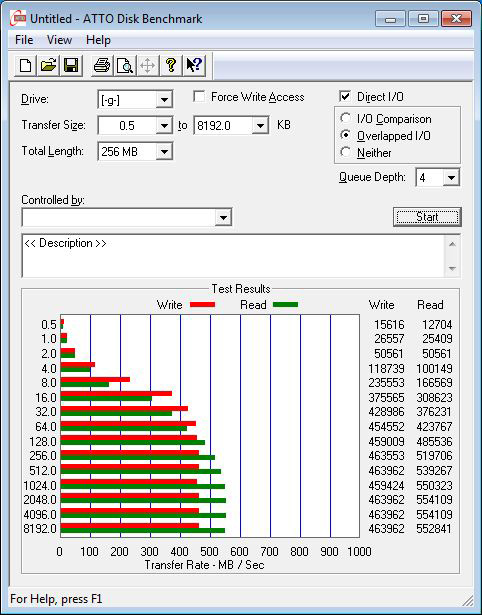
The ATTO disk benchmark values gives a very good overview about the write and read rate on different file sizes.
Here we see a huge difference between legacy IDE and AHCI, especially with this SSD.
These values are maximum ratings, which are different to the previously continuous transfer rate benchmarks.
The write performace (red) is in legacy IDE mode higher than the read performance (green), but in AHCI we see a much higher read performance.
Here is a Snipping screenshot of the ATTO Disk benchmark values (SATA3):
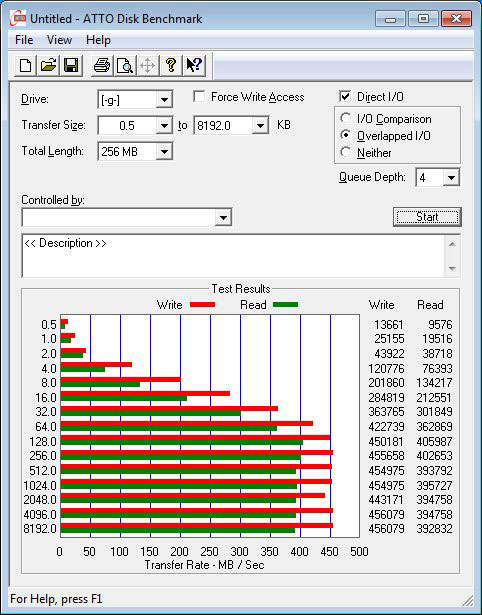
Compared to this result, the read performance in AHCI mode is significantly increased in all transfer sizes.
Here we see a comparison of the conventional native IDE mode and the modern AHCI mode, which offers beside the higher performance also advantages like e.g. the support of NCQ (Native Command Queuing) and Hot-Plug.
Here is a Snipping screenshot of the ATTO Disk benchmark values (on SATA3 AHCI):
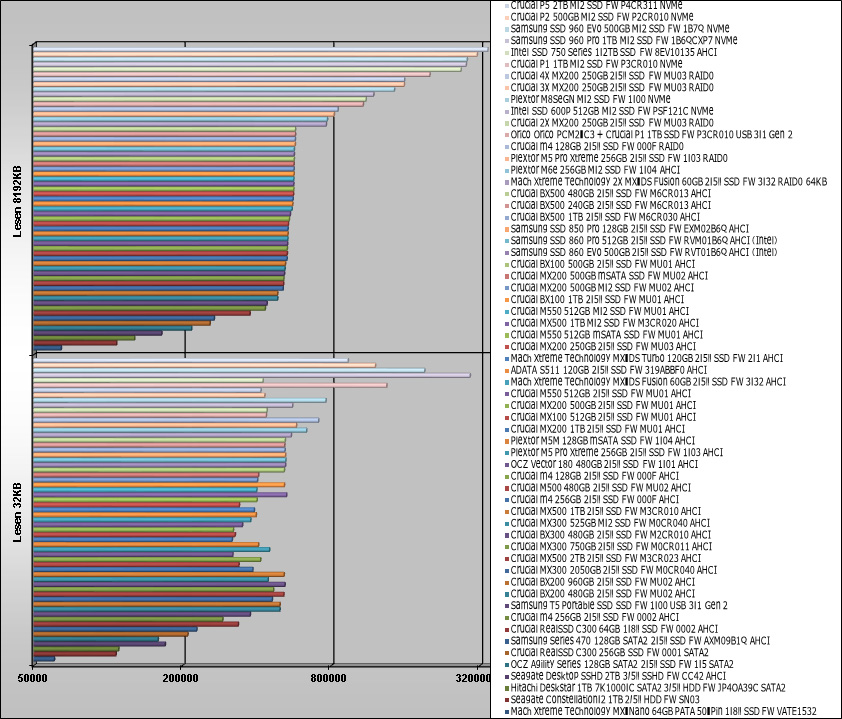
These ATTO disk benchmark values are compared with a small transfer size of 32KB and a large transfer size of 8192KB.
The bar chart already shows a first comparison to the Hitachi Deskstar 7K1000.C 1TB hard disk drive, OCZ Agility 120GB SSD, Crucial 256GB C300 RealSSD and a few other SSDs, wherat the 8192K result of the Mach Xtreme Technology MX-DS Fusion reached the current top SSD results.
Here is a comparison of the ATTO disk benchmark values, which are getting updated with soon coming drives:
With CrystalDiskMark one receives a balanced measurement of the performance with different transfer sizes.
Here is a Snipping screenshot of the CrystalDiskMark values (SATA3):
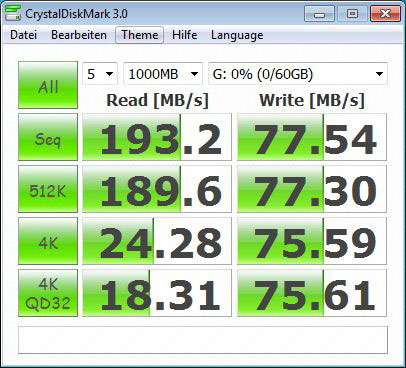
As seen in the previous 4K-64Threads results, especially the read and write 4K QD32 and the sequential read result is much higher when operating in AHCI mode.
Here is a Snipping screenshot of the CrystalDiskMark values (SATA3 AHCI):

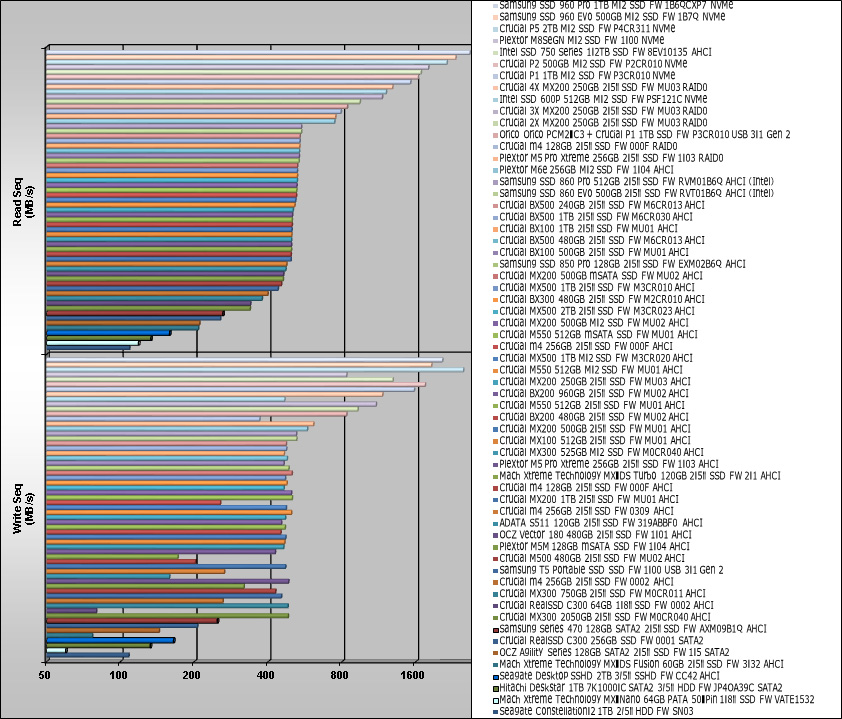
The following diagram shows the CrystalDiskMark results once again compared with other SSDs and platter drives, which are extended step by step.
In the CrystalDiskMark comparison one can see significant differences between the to-date tested Solid State Drives and Hard Disk Drives, where the tested Mach Xtreme Technology MX-DS Fusion 60GB SSD is currently in the lower half of our currently tested SSDs.
Here is a comparison of the CrystalDiskMark values, which are getting updated with soon coming drives:
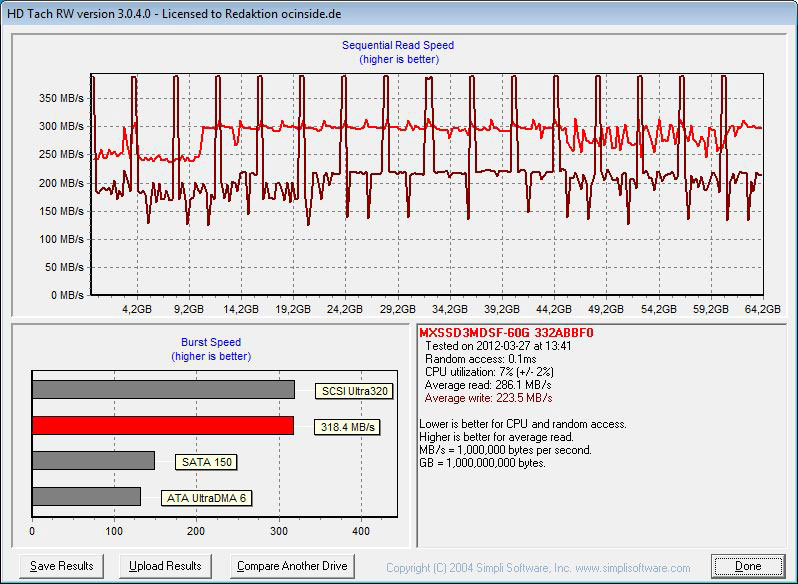
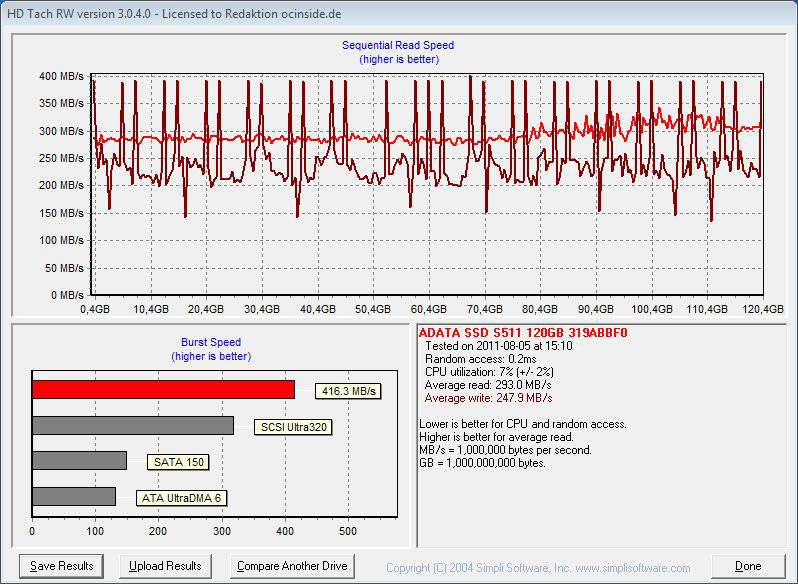
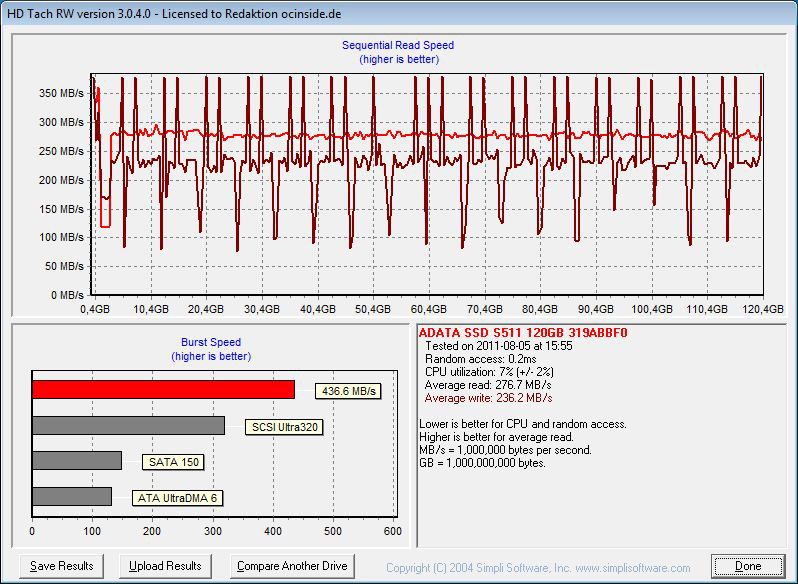
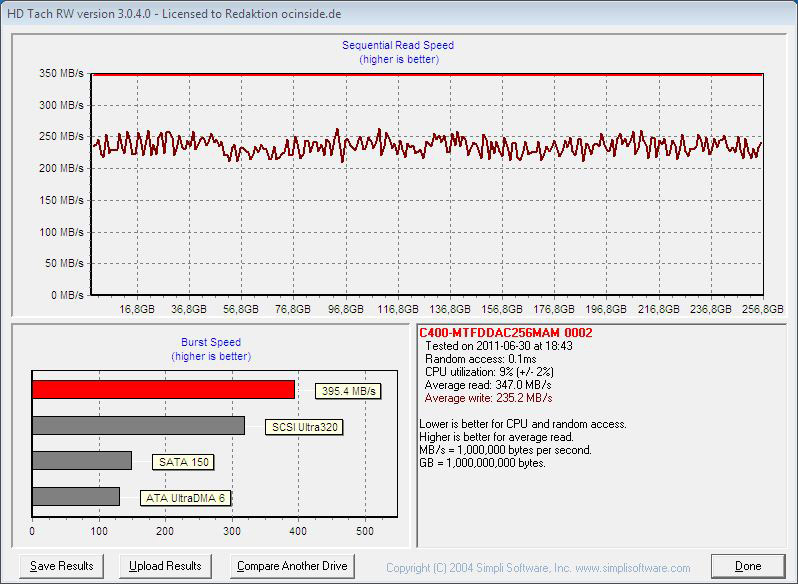
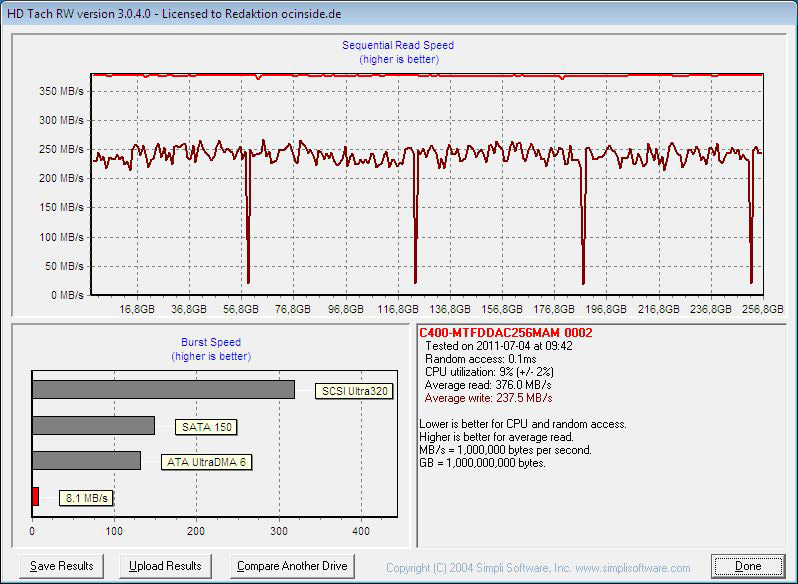
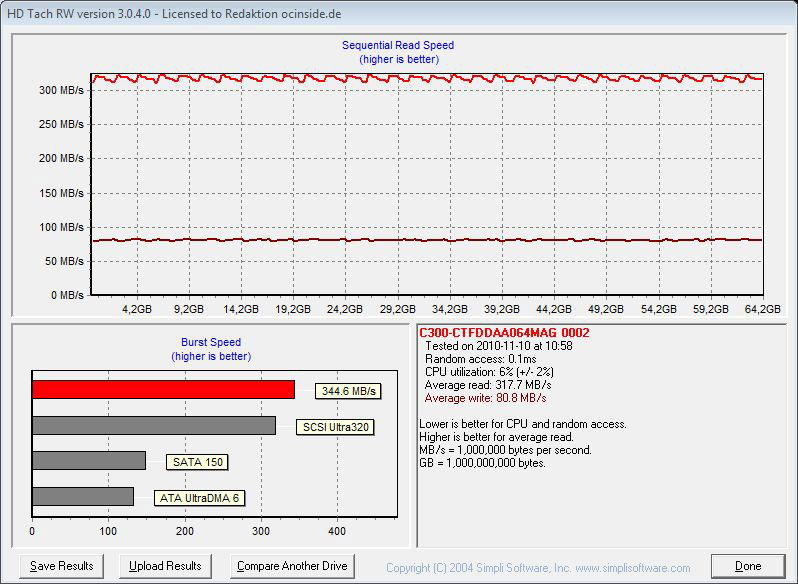
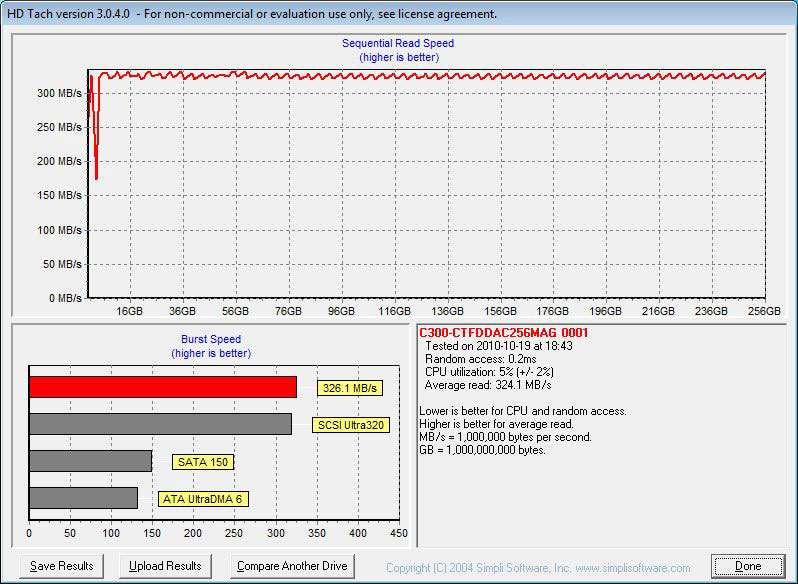
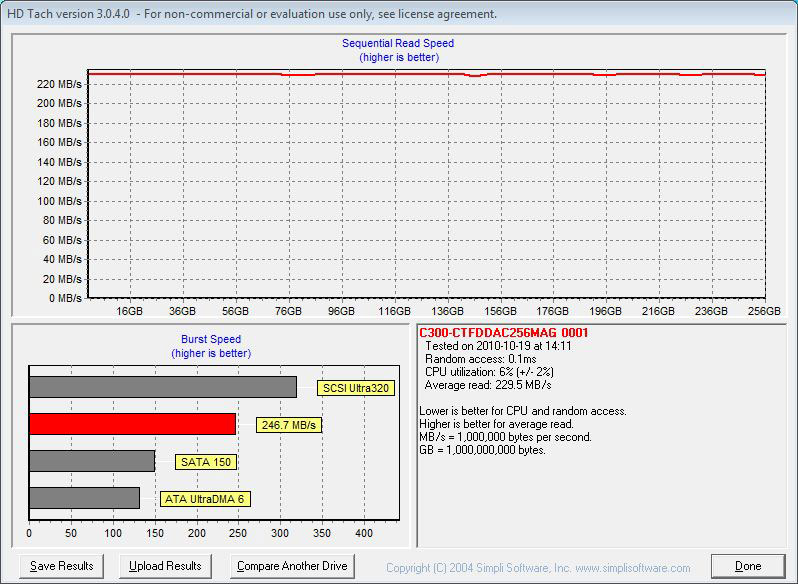
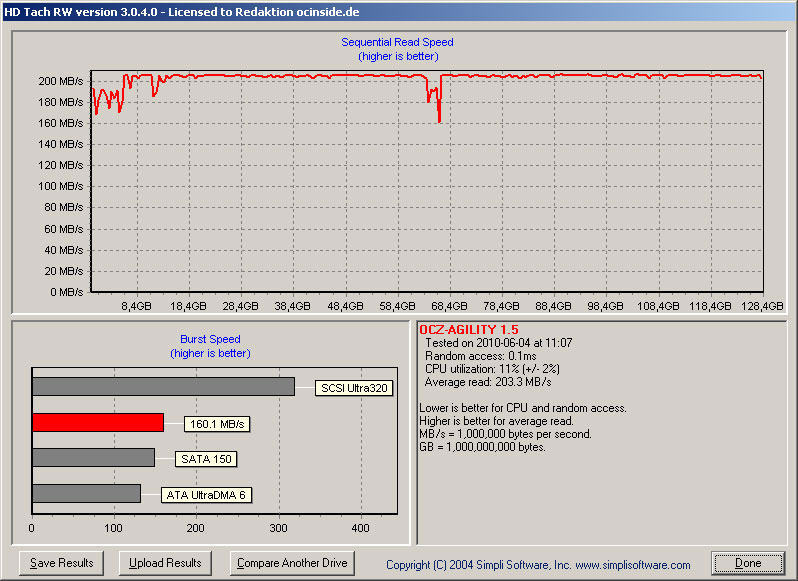
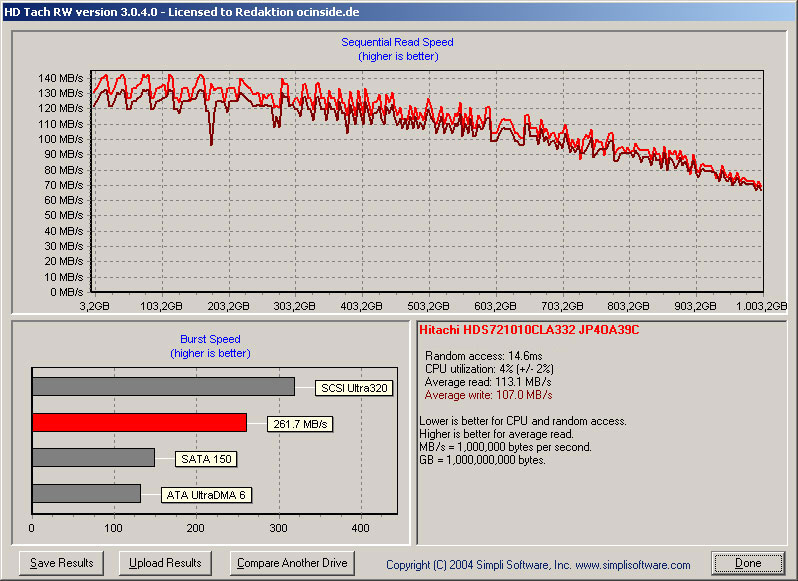
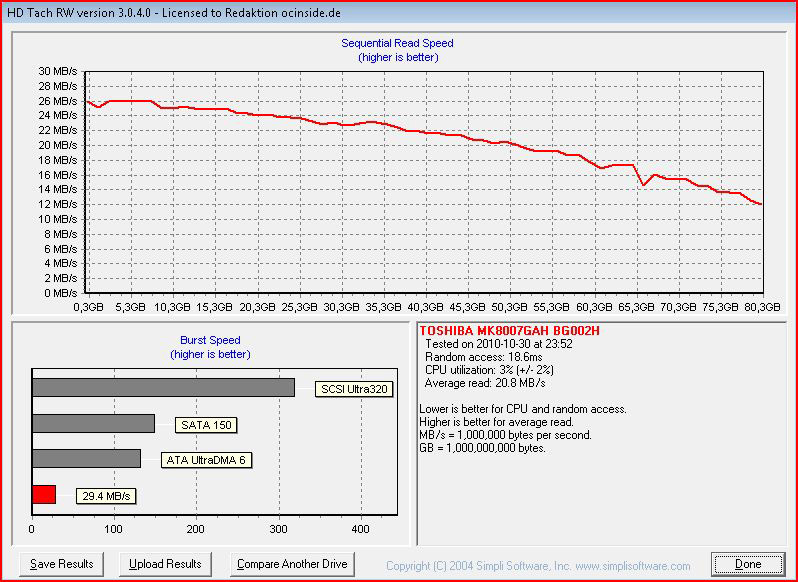
With HD Tach one can measure the gradient of the performance.
The Mach Xtreme Technology MX-DS Fusion 60GB 2.5″ SSD has in both AHCI and legacy IDE mode very fluctuating transfer rates.
New logical NAND cell access of the SSD controller results like some other equal buils SSDs in strong varying values with the latest HD Tach Version 3.0.4.0 version.
To compare these results with SATA3 IDE values, you can move the cursor over this MX-DS Fusion 60GB SSD SATA3 IDE link.
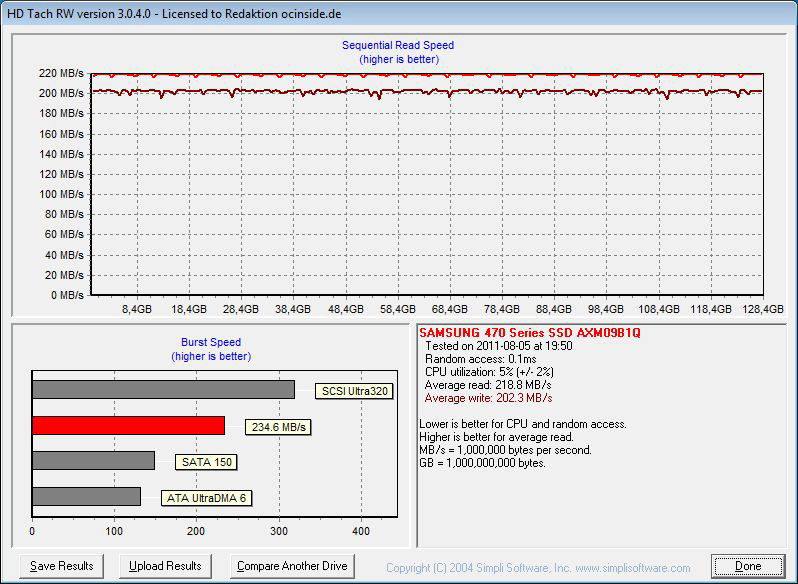
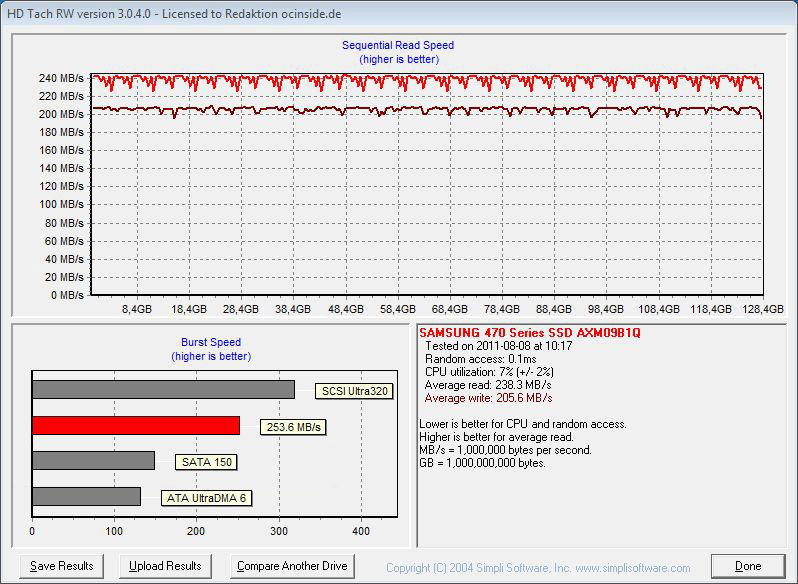
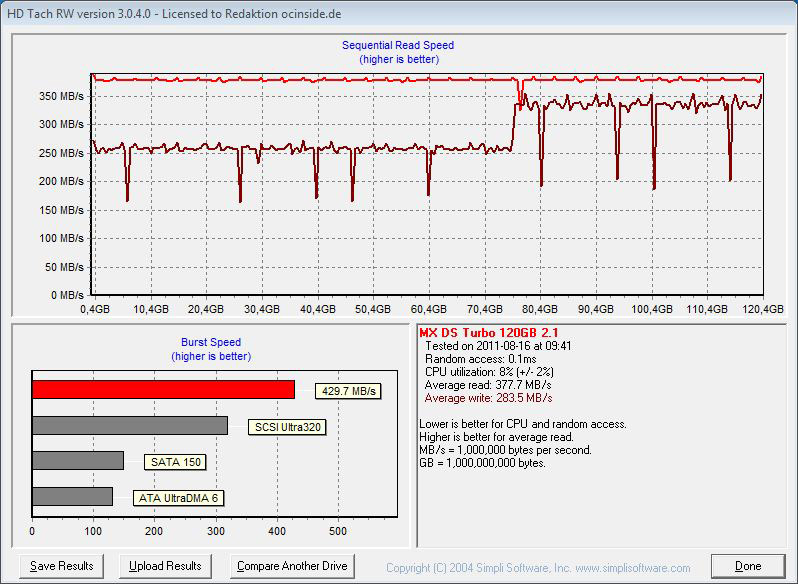
Furthermore you can move the mouse over the following drives to see their respective benchmark results:
Samsung Series470 128GB SSD AHCI, Samsung Series470 128GB SSD Legacy IDE, MX-DS Turbo 120GB SSD an SATA3 AHCI, ADATA S511 120GB SSD at SATA3 AHCI, ADATA S511 120GB SSD at SATA3 AHCI, Crucial m4 256GB 2,5″ SSD at SATA3 AHCI, Crucial m4 256GB 2,5″ SSD at SATA3 crucial C300 64GB 1,8″ SSD at SATA3, Crucial RealSSD 256GB 2,5″ SSD at SATA3, crucial RealSSD 256GB 2,5″ SSD at SATA2, OCZ Agility 128GB SSD, Hitachi 7K1000.C 1TB disk drive and Toshiba MK8007GAH 1.8″ disk drive.
Here is a Snipping screenhot of the HD Tach benchmark values:
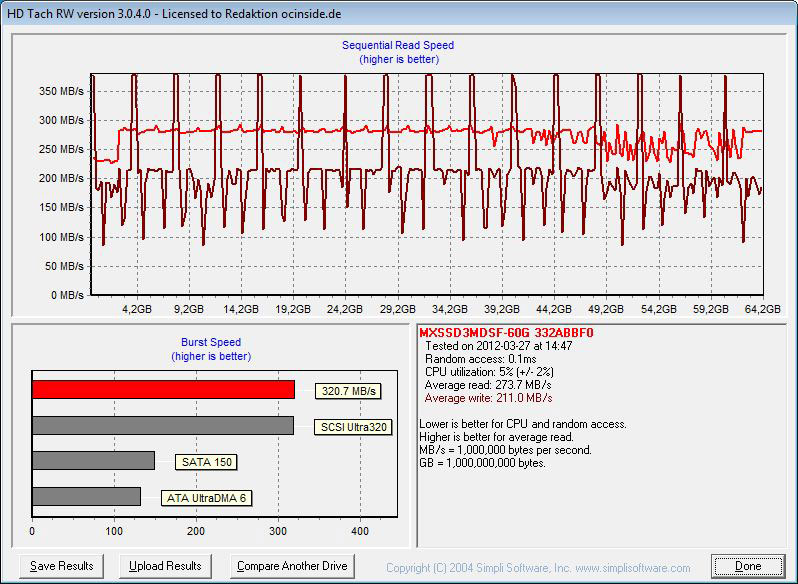
The comparison of the HD Tach benchmark results shows the read speed, write performance and the lower average access time of the Solid State Drive compared to hard disk drives with their much higher access time.
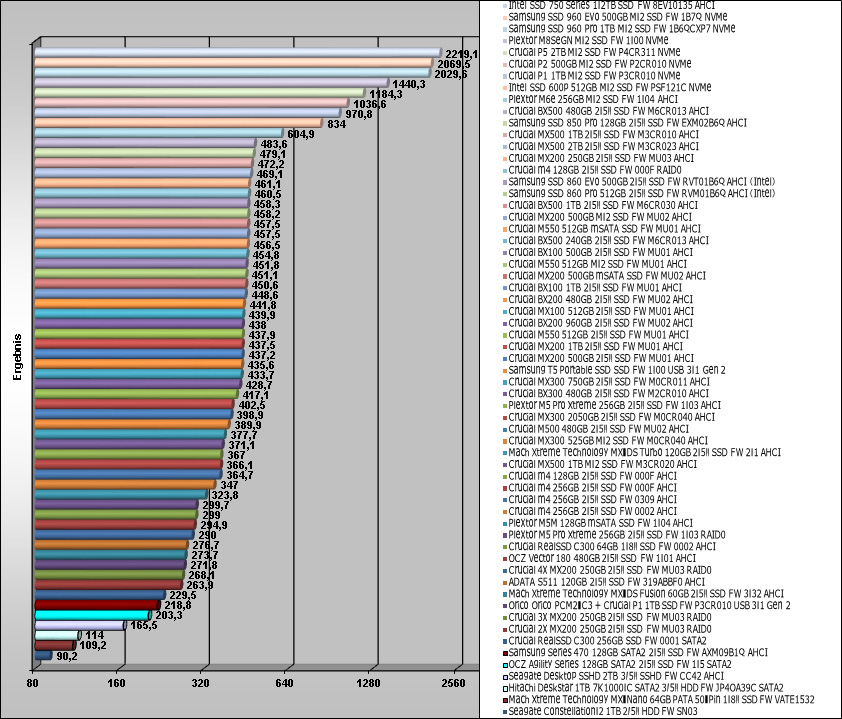
Here is an comparison of the HD Tach benchmark values, which are getting updated with soon coming drives:
SiSoftware Sandra benchmark result
Of course, SiSoftware Sandra benchmark should not be missing in this test series.
SiSoftware offers with their SiSoft Sandra program a very comprehensive tool, which contains a lot of tools to get very reliable test results of all hardware components.
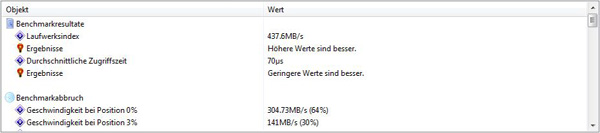
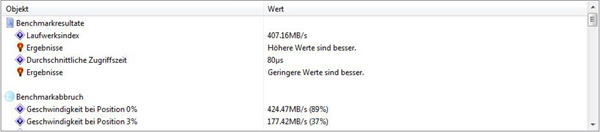
The average access time of the Mach Xtreme Technology MX-DS Fusion 60GB SSD was in SiSoftware Sandra with 70us (equal to 0.07ms) low.
The drive index was in IDE mode high 437,6 MB/s and in AHCI mode 407,16 MB/s.
Here is a Snipping screenshot of the SiSoftware Sandra benchmark values (SATA3):
Here is a Snipping screenshot of the SiSoftware Sandra benchmark values in AHCI mode (SATA3 AHCI):
Here is a comparison of the SiSoftware Sandra benchmark values, which are getting updated with soon coming drives: