
Setup and test results …
Now we come to the benchmark results. The test results for M.2 modules are done with an ASRock X670E Taichi motherboard. Microsoft Windows 11 Pro and Microsoft Windows 10 Enterprise Edition 64-bit are currently used as the operating system.
The following SSD benchmark software was used to check and compare the drive’s possible speed:
AS SSD Benchmark – Download
CrystalDiskMark – Download
HD Tach – Download
SiSoftware Sandra – Download
Windows Kopiervorgang
AS SSD benchmark results …
The AS SSD benchmark values offer a very good indication of the maximum possible read and write speed, the speed for smaller files and their respective access times. By the way, 4K means that small 4K blocks are read or written and this is distributed to 64 threads simultaneously in the 4K 64Thrd. Thus, the benchmark program simulates a typical program start, for example.
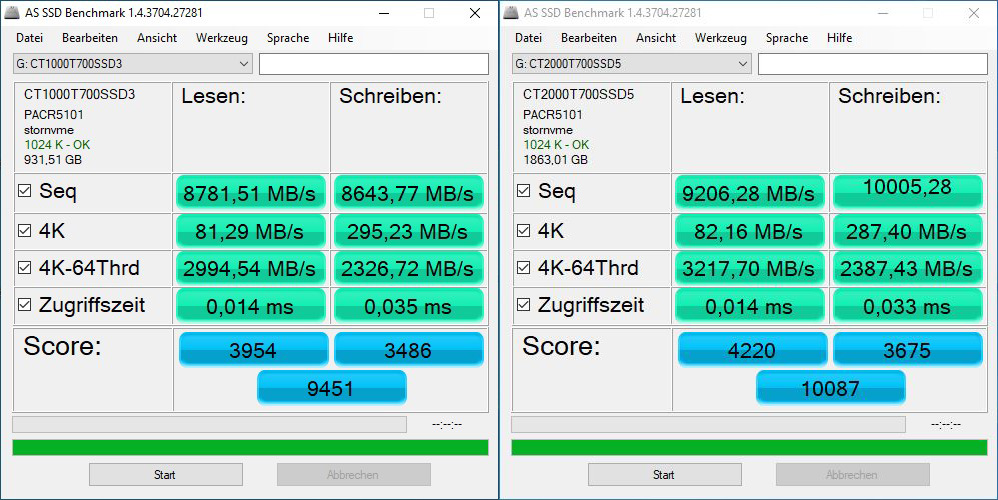
Extremely high sequential read and write speeds were achieved with the 1000GB Crucial M.2 T700 without heatsink and the 2000GB T700 with heatsink. For the Crucial T700 PCIe Gen5 SSD, read was 8781 MB/s and write was 8643 MB/s. For the T700 2TB PCIe Gen5 SSD with heatsink, read was as high as 9206 MB/s and write was 10005 MB/s. In comparison, the Crucial P5 PCIe Gen3 2TB SSD was 2852 MB/s read and 2525 MB/s write. The Crucial P5 Plus PCIe Gen4 1TB SSD was at the highest performance so far of 5422 MB/s in read and 4520 MB/s in write. So you can already see the clear advantage of PCIe Gen5 over the previous PCIe Gen4 or PCIe Gen3 SSDs.
By the way, the usable capacity of the Crucial T700 1TB is 931.51 GB and the Crucial T700 M.2 2TB is 1863.01 GB.
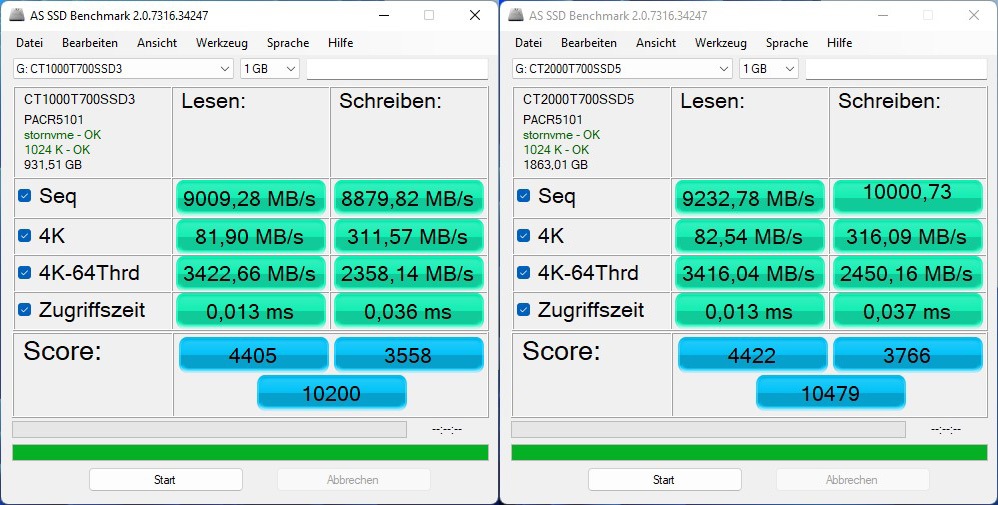
The Crucial T700 1TB M.2 NVMe achieves 9451 points under Windows 10 and the Crucial T700 2TB is at 10087 points. The Crucial T700 1TB M.2 NVMe even achieves 10200 points under Windows 11 and the Crucial T700 2TB is at 10479 points. In the Crucial P5 test we only achieved 5502 points and in the Crucial P5 Plus test we achieved 7683 points with fast PCIe Gen4 x4 connectivity.
Here is a screenshot of the AS SSD benchmark values (Crucial T700 1TB vs T700 2TB SSD AMD Windows 10 test system):
Here is a screenshot of the AS SSD benchmark values (Crucial T700 1TB vs T700 2TB SSD AMD Windows 11 test system):
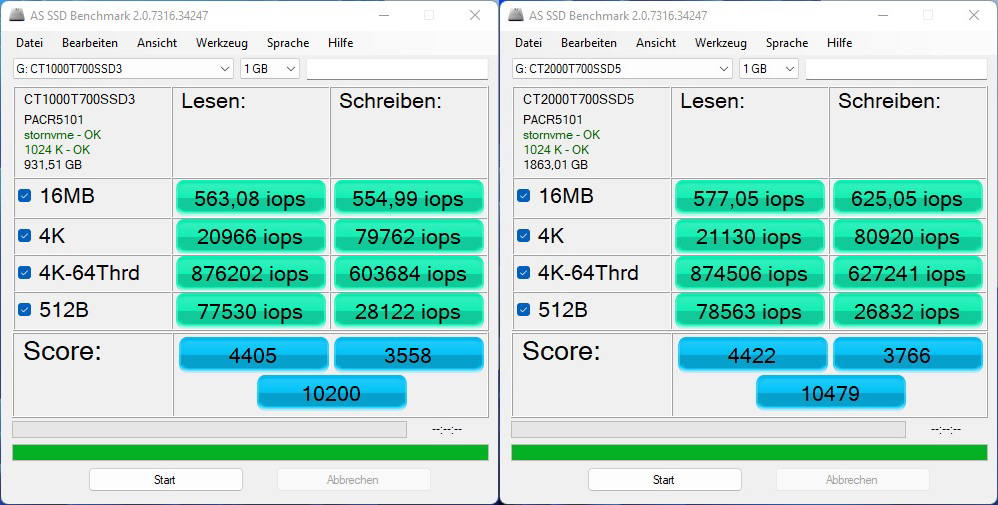
Here is another screenshot of the AS SSD iops results (Crucial T700 1TB vs T700 2TB SSD AMD Windows 11 test system):
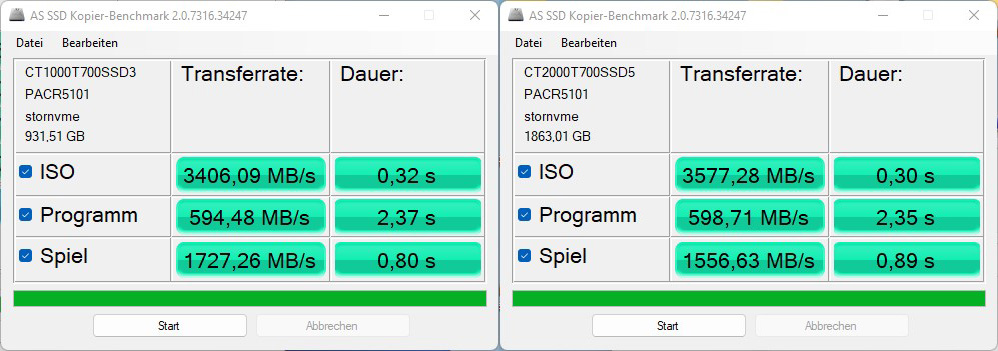
And here is a screenshot of the AS SSD copy benchmark values (Crucial T700 1TB vs T700 2TB SSD AMD Windows 11 test system):
CrystalDiskMark Result …
CrystalDiskMark also provides a balanced measurement of the performance with different transfer sizes.
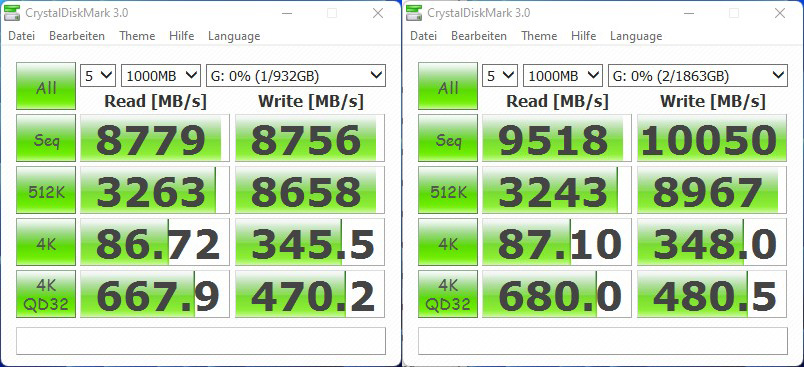
The T700 1TB achieves very good sequential read rates of 8779 MB/s and write rates of 8756 MB/s in addition to the high 4K-64 threads rates. The T700 2TB achieves significantly better sequential read rates of 9518 MB/s and even write rates of 10050 MB/s.
Here is a screenshot of the CrystalDiskMark scores (left Crucial T700 1TB vs Crucial T700 2TB right):
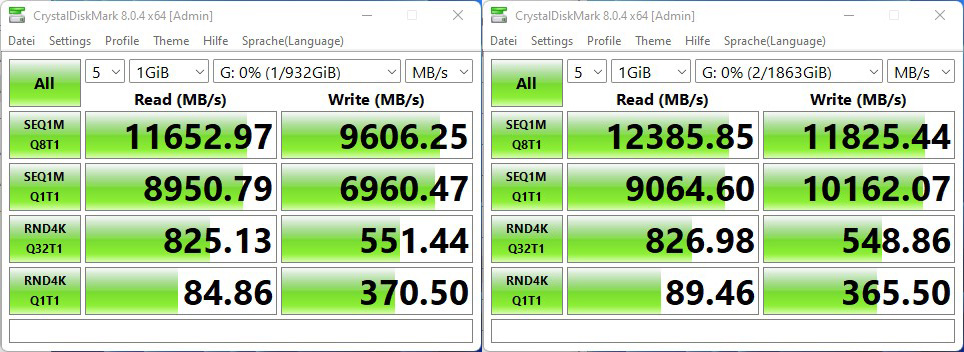
Since the version was kept the same for a comparison with the previous CrystalDiskMark scores, we performed the benchmarks with the latest CrystalDiskMark 8.0.4 x64 version again separately. Here, the T700 1TB achieves extremely high sequential read rates of 11652 MB/s and write rates of 9606 MB/s. The Crucial T700 2TB can even top that and achieves even better sequential read rates of 12385 MB/s and even write rates of 11825 MB/s – strong performance!
Here is a screenshot of the CrystalDiskMark 8 scores (Crucial T700 1TB on the left vs Crucial T700 2TB on the right):
HD Tach Result …
The HD Tach benchmark values show the course of the performance very well, but it is clearly different for an SSD than for a conventional HDD. Due to the new logical management of the SSD controllers when accessing the NAND cells, the values can fluctuate with the HD Tach version 3.0.4.0, which is designed for hard disks, like in similarly constructed SSDs.
To see how the 232 layer 3D TLC NAND flash with the used controller behaves during a larger file transfer, we ran the lengthy Long Bench. There were hardly any performance drops, which we know from QLC SSDs during longer write accesses.
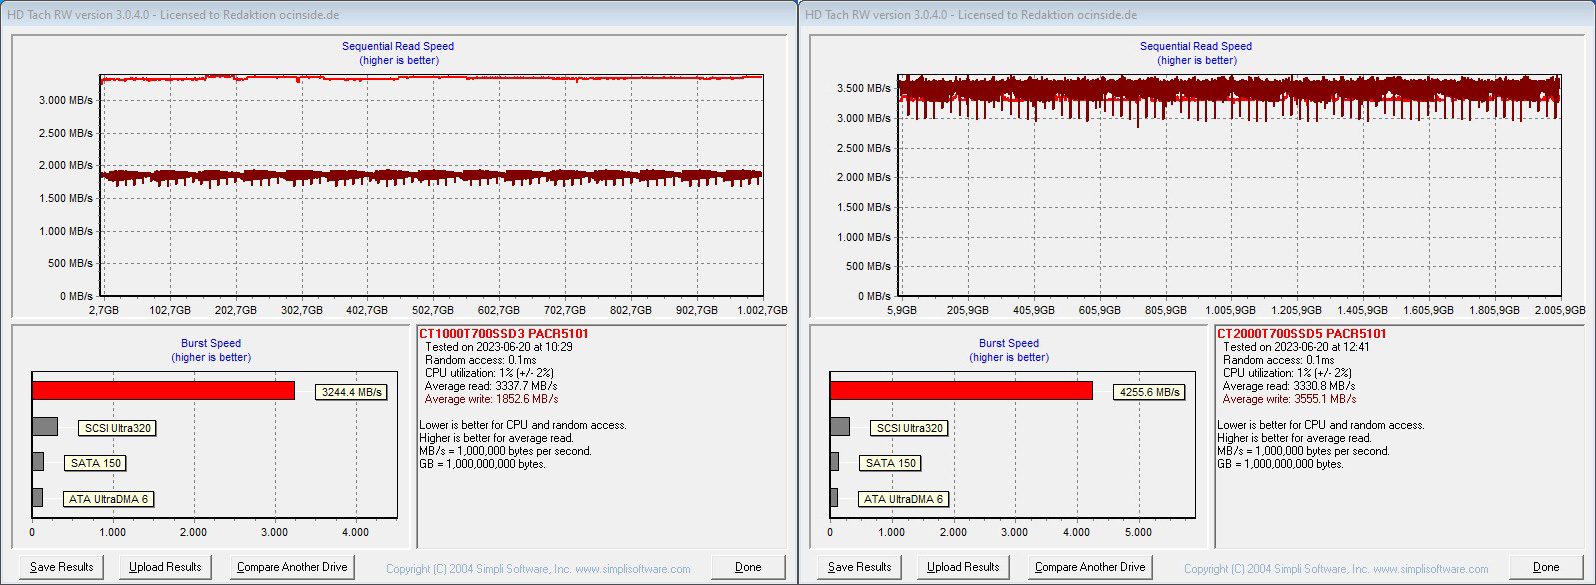
HD Tach showed a consistent read and write performance for both Crucial T700s, which could be maintained from start to finish. The Crucial T700 2TB M.2 SSD hardly showed any peaks in both the read and write processes and, like the T700, low access times of 0.1ms.
Here is a screenshot of the HD Tach benchmark values (left Crucial T700 1TB vs T700 2TB SSD right):
SiSoftware Sandra benchmark results …
Of course, the SiSoftware Sandra benchmark must not be missing in the test series. SiSoftware has had a very comprehensive tool on the market for many years with the SiSoft Sandra program, with which you can get very reliable test results from all hardware components.
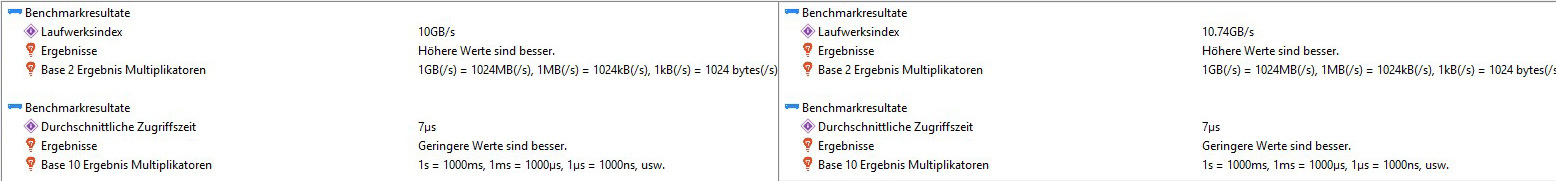
The average access time of the Crucial T700 1TB M.2 NVMe SSD was extremely low at 7us in SiSoftware Sandra and the drive index of up to 10GB/s is an excellent value. The average access time of the Crucial T700 2TB M.2 NVMe SSD was also extremely low at SiSoftware Sandra with 7us and the drive index of up to 10.74GB/s is about the same.
Here is a screenshot of the SiSoftware Sandra benchmark read values (left Crucial T700 1TB vs T700 2TB SSD right):
Windows Copy benchmark results …
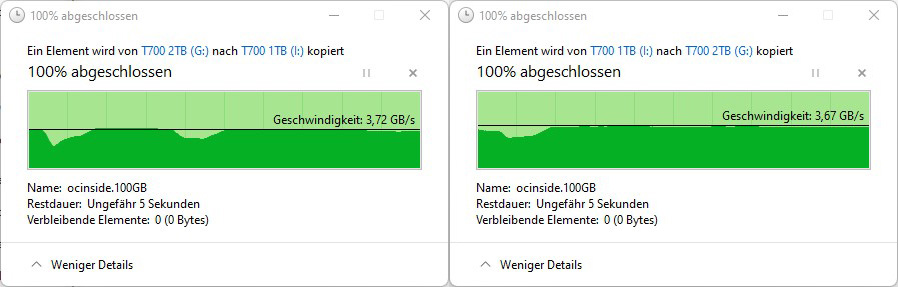
Even during longer and repeated benchmark runs, the determined measured values were constant except for small peaks. We also stressed the Crucial T700 1TB and T700 2TB with common file copy processes. But even saving a 100GB test file from the Crucial T700 2TB PCIe 5.0 x4 NVMe SSD to the Crucial T700 1TB PCIe 5.0 x4 NVMe SSD, there was a continuous transfer rate of about 3.72 GB/s. When copying a 100GB test file from the Crucial T700 1TB PCIe 5.0 x4 NVMe SSD to the Crucial T700 2TB PCIe 5.0 x4 NVMe SSD, there was a continuous transfer rate of about 3.67 GB/s.
Crucial T700 1TB vs T700 2TB M.2 NVMe SSD with heatsink Result and general impression …