

Benchmark values and test results …
All AMD graphics card benchmarks has been tested with the following hardware and software:
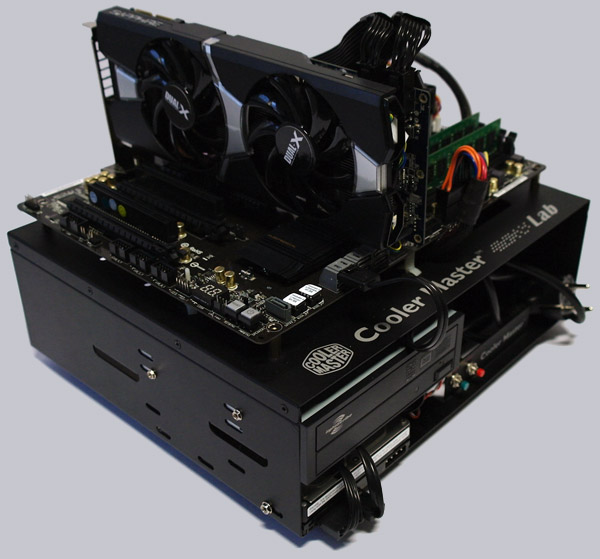
Tested is like at the previous MSI Radeon R9 280 Twin Frozr Gaming 3GB review with the following system:
CPU: AMD A10-7850K Sockel FM2+ Kaveri APU
Motherboard: ASRock FM2A88X Extreme6+
RAM: 2x 2GB Crucial DDR3-1333
PSU: Cooler Master Silent Pro M 600W power supply
OS: Windows 7 Ultimate 32-Bit
Video card driver: AMD Catalyst 14.4
Software (can be found at our OC Download page):
– Futuremark 3DMark Professional
– Futuremark 3DMark06 – the Serial number is now available for free at our download page 😉
– Furmark GPU Stress Test 1.13.0
– Sapphire TRIXX
– GPU-Z
3DMark Benchmark with default clock rates …
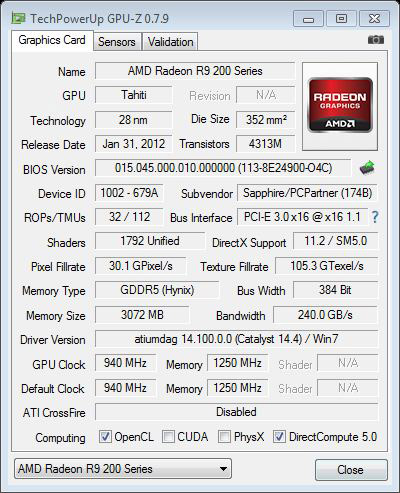
The Sapphire TRIXX app was not installed for the first benchmark tests, to get no distorted values. Here are the GPU-Z values without overclocking:
Let’s move on to the 3DMark test “Ice Storm”, which is characterized by a virtual space battle. With the default settings the card reached a 3DMark Ice Storm score of 75106 (MSI Radeon R9 280 Twin Frozr Gaming reached 75186 points).
Now follow the test “Cloud Gate” in which a virtual Jumpgate catapults spaceships into the final frontier. Also in this test the graphics card achieved a good score of 10780 (MSI Radeon R9 280 Twin Frozr Gaming reached 10811).
We now come to the last 3DMark test, the “Fire Strike” in which an assassination attempt on a creature that might just escaped from Tron happens. The card reached a well 3DMark Fire Strike score of 5512 points (MSI Radeon R9 280 Twin Frozr Gaming reached 5625).

In addition we have tested the good old 3DMark06 benchmark which provides a good comparison value of non-DX10 capable systems. Here, the Sapphire Radeon R9 280 Dual-X OC 3GB graphics card scored 19242 3DMarks (the MSI Radeon R9 280 Twin Frozr Gaming reached 19264 3DMarks).

3DMark Benchmark with OC clock rates …
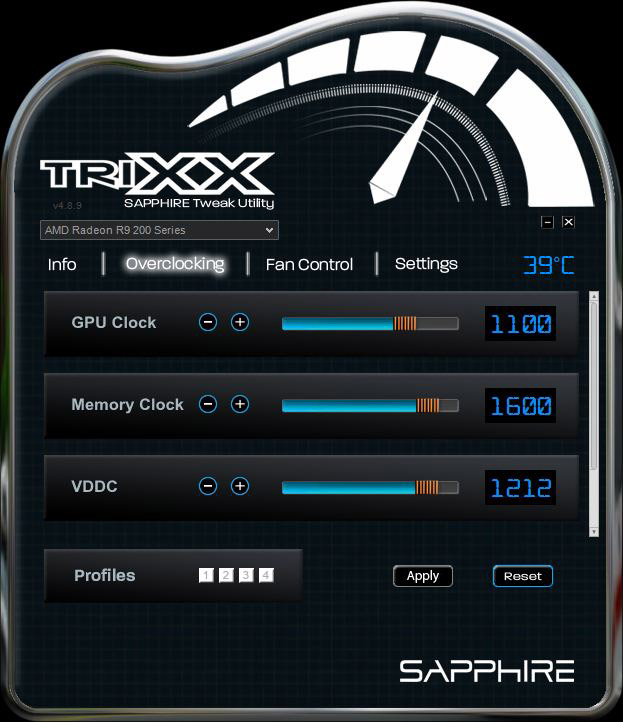
Now we have overclocked the graphics card by the supplied Sapphire TRIXX Tool to 1100/1600 MHz and go through the benchmarks again.
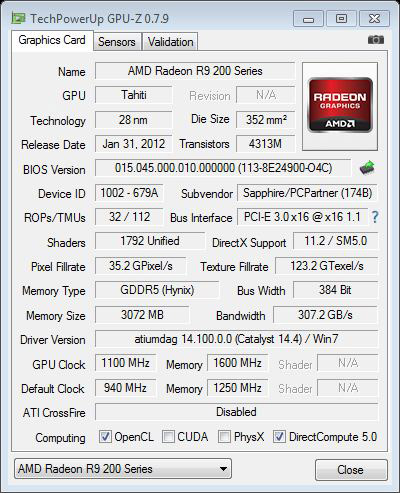
Here you can see the GPU-Z values with graphics card overclocking:
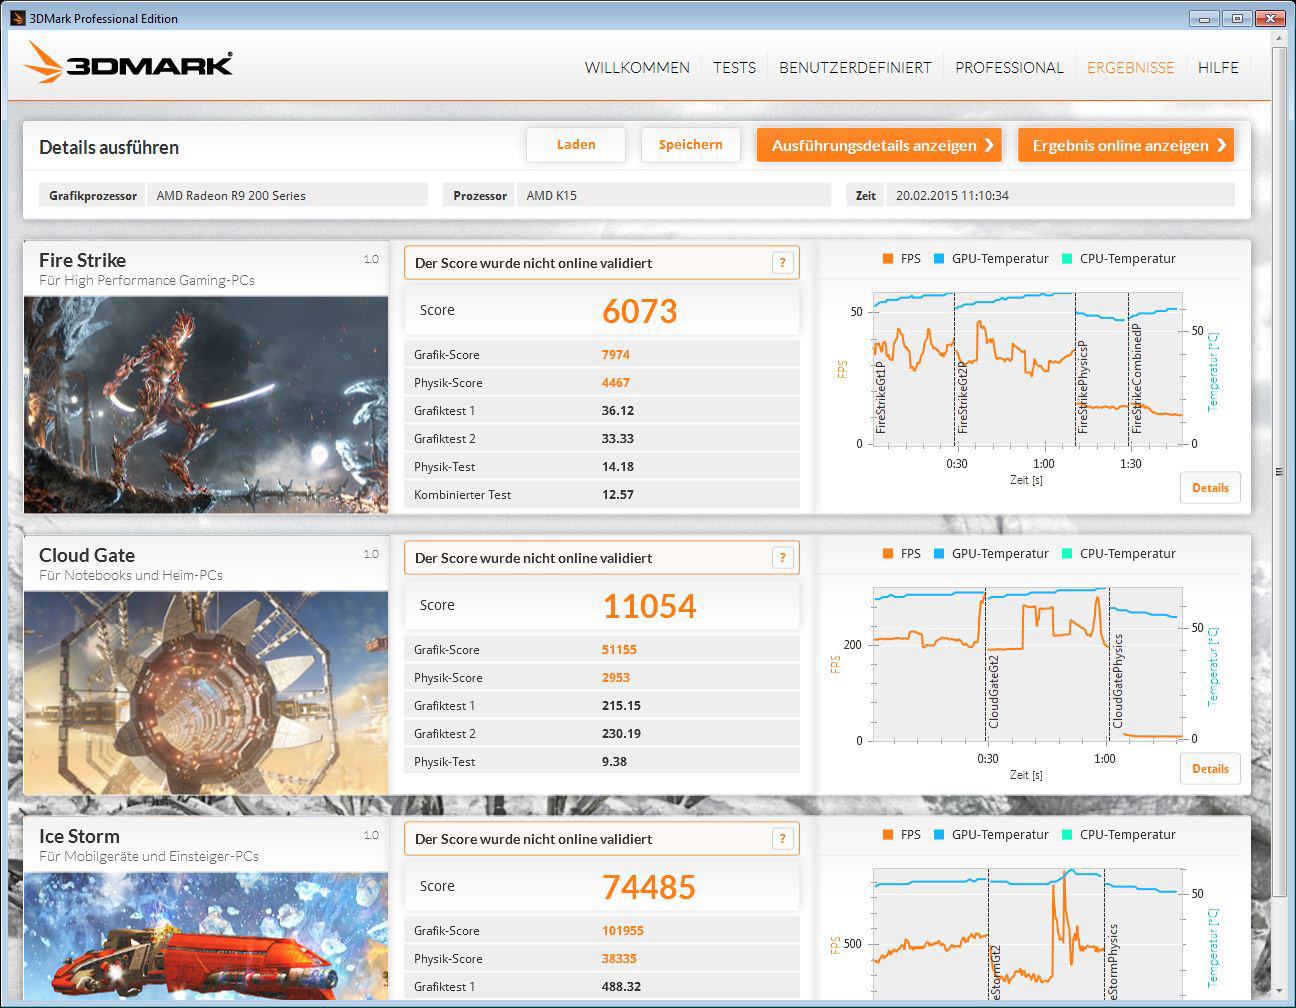
With the OC settings on 1.1 GHz GPU and 1.6 GHz RAM the card reached a higher score of 75543 points in Ice Storm. 3DMark Cloud Gate benchmark finished now with the overclocked graphics card at 11008 points. And with OC, the graphics card reached in 3DMark Fire Strike benchmark 6064 instead of 5512 points.
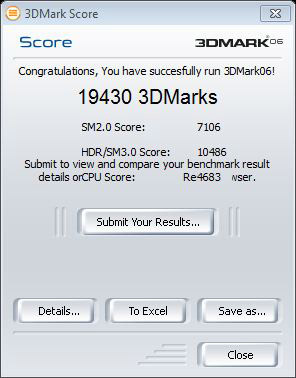
In the 3DMark06 benchmark reached the OC’d R9 280 graphics card now 19430 3DMarks instead of 19242 3DMarks.
The difference between the OC values and the default values is clearly visible, even though we did not increase the VDDC nor the power limit, so the graphics card was still cool.
Maximum video card temperature …
Speaking of cooling, we now come to the cooling system and the thermal design of the graphic card. What could you test the cooling of a graphics card better than with the tool FurMark …
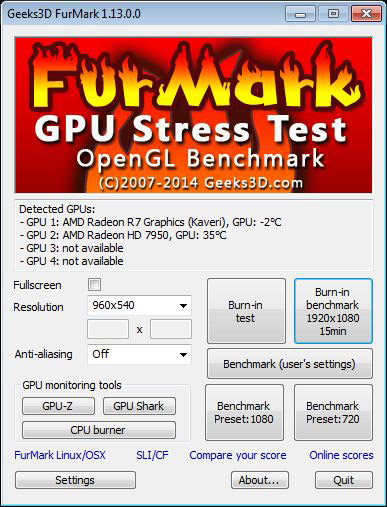
Not without reason there is a warning in the tool to be careful, because after the launch maximum power is thermally and electrically generated, which shows any hardware weaknesses immediately and mercilessly and might result in crashes. We used the default settings and obtained the following results after 15 minutes of burn-in testing:
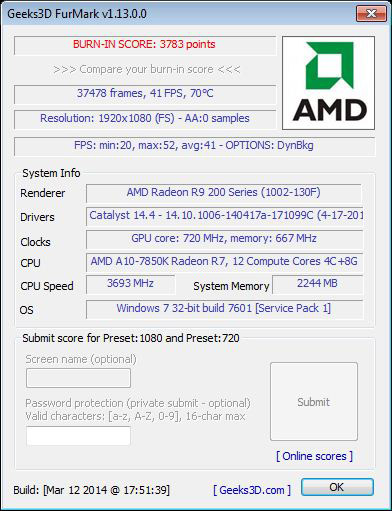
During the burn-in tests you can follow the temperature rise easily, which was increased to a maximum of approx. 71°C, where the fans were still relatively quiet:
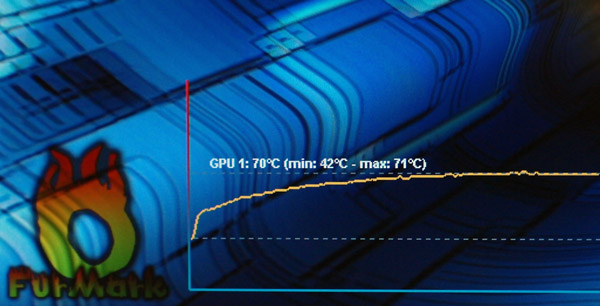
So, the Sapphire Dual-X cooling does all the work and cool the graphics card even with heavy load reliable and relatively quiet on a low temperature.
Video Card power consumption …