
AMD Ryzen 5 7600X benchmark results …
For the benchmarks, we chose the following programs, which can be downloaded from the download page.
Quickly to the right benchmark …
| Benchmark Tools |
| Cinebench R15 |
| Cinebench R23 |
| CPU-Z |
| PCMark 10 |
| 3DMark |
All benchmarks were run several times with BIOS default settings and the result was averaged afterwards. Afterwards, the performance preset “PBO, 85°C, Curve Optimizer -30mV” was activated in the BIOS and all tests were run again. Since not all tests performed are purely CPU-limited, the determined results sometimes do not scale with the overclocking, which we will discuss in more detail in the individual tests.
Cinebench R15 …
| Cinebench R15 | standard | overclocked |
| single core | 314 | 320 |
| multi core | 2505 | 2645 |
Cinebench R15 scales very well with the overclocking. After selecting the performance preset, a significantly higher clock rate could be ascertained during the runs, especially in the multi-core test. This is also reflected in an overall score that is about 5.6% better. In the single-core test, there was an increase in points of 2%.
Cinebench R23 …
| Cinebench R23 | standard | overclocked |
| multi core | 15145 | 16040 |
A similar picture is seen in Cinebench R23, where the score increases by almost 6% when overclocked. With default settings, the clock frequency fluctuated slightly and reached peaks around 5350 MHz. With the selected performance preset, the clock frequency remained constant at 5500MHz.
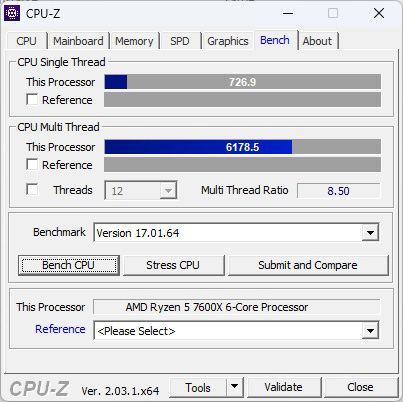
CPU-Z …
CPU-Z’s benchmarks do not seem to be optimized for modern multi-core processors or are significantly dependent on other factors besides the CPU. The test results do not consistently scale with overclocking and the processor utilization was mostly only about 8% even in the multi-threaded tests.
| CPU-Z V2.03.1-X64 | standard | overclocked |
| V17.01.64 single core | 752 | 731 |
| V17.01.64 multi core | 6080 | 6182 |
The CPU did not clock above 4500MHz in the CPU-Z tests with standard settings as well as in overclocked state.
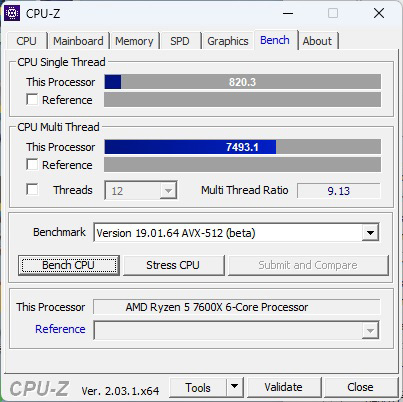
The AVX-512 test from CPU-Z shows a similar result.
| CPU-Z V2.03.1-X64 | standard | overclocked |
| V19.01.64 AVX512 single core | 818 | 965 |
| V19.01.64 AVX512 multi core | 7482 | 7486 |
In CPU-Z’s AVX512 test, the single threaded test scaled well with overclocking this time, but the multi-threaded test remained virtually unchanged. The CPU was also not fully utilized this time, as HWInfo reported a CPU utilization of only 8%. Since the individual readings also showed significant fluctuations, it could also be that the Windows thread sceduler is not yet utilizing the new Ryzen processors perfectly under certain circumstances.
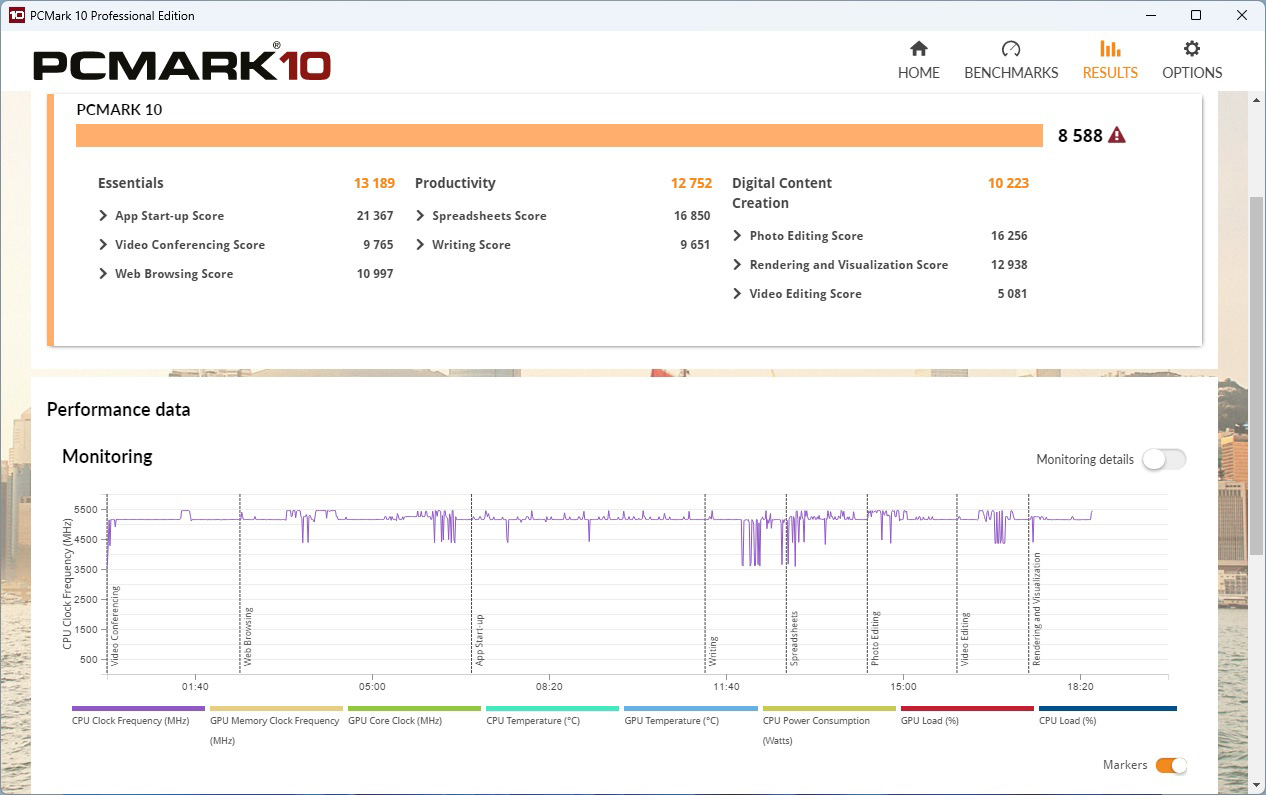
PCMark 10 …
In PCMark 10, the results varied only minimally between auto-setting and overclocking. The total score was always in the range of about 8600 points.
3DMark …
3D Mark Time Spy …
In the CPU test of the Time Spy benchmark, a GPU limitation is present despite a not so weak AMD RX580 graphics card. From the middle of the benchmark, the GPU utilization graph shows 100%, which could be due to a limitation of the graphics memory throughput, since the GPU was hardly utilized. With a CPU score of around 9600 points, the result is a few hundred points higher than that of an AMD Ryzen 5 5600X, but not as high as it should be. The Ryzen 7600X was also only utilized to about 40%. Much higher results are probably possible with a more potent graphics card.
3D Mark Fire Strike …
A similar picture was seen in the older Firestrike Physic benchmark. With 29300 points, the result is 17% higher than that of a Ryzen 5600X, but the CPU was not fully utilized here either. The Ryzen 7600X literally cries out for a faster graphics card, the RX580 limits mercilessly in our case, so we will also save the 3D Mark graphics tests.
AMD Ryzen 5 7600X Power consumption and temperatures …