

Benchmark values and test results …
Let us continue with the benchmark results. SATA3 drives are tested with an ASRock 890GX Extreme3 motherboard (for comparing with the first SSD results) and test results of mSATA and M.2 modules are performed using an ASRock Z97 Extreme6 motherboard. At present, Microsoft Windows 7 Ultimate Edition is used as the operating system.
The SSD drive speed was examined and compared with the following benchmark software:
AS SSD Benchmark – Download
ATTO Disk Benchmark – Download
CrystalDiskMark – Download
HD Tach – Download
SiSoftware Sandra – Download
The SSD benchmark results offers a very good reference point of the maximal possible reading and writing performance, the speed with smaller files and the respective access time. 4K means that small 4K blocks are read and/or written and with the 4K 64Thrd this is distributed on 64 Threads at the same time. Thus the benchmark program simulate for example a typical program start.
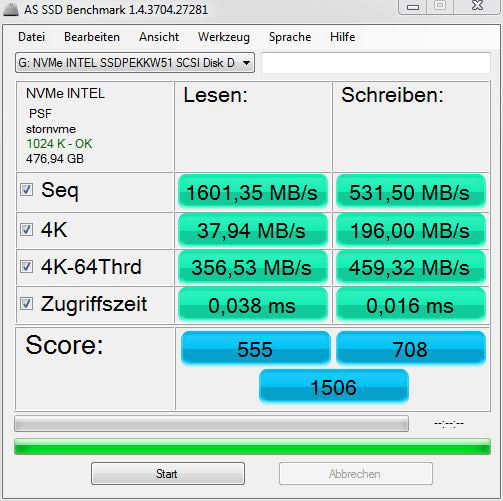
The 512 GB Intel SSD module achieved a very high maximum sequential read speed of 1601.35 MB/s and a writing speed of only 531.50 MB/s was achieved with the TLC Flash. In AS SSD, the Intel 600p 512GB M.2 NVMe SSD achieves a total score of 1506 points. This is well behind the previously tested Plextor M8Se NVMe SSD, which achieved a read rate of 2189.94 MB/s and a write rate of 901.59 MB/s, but it is also much higher in price.
The usable capacity of the Intel M.2 NVMe SSD is 476.94 GB after over provisioning.
Here is a screenshot of AS SSD benchmark values:
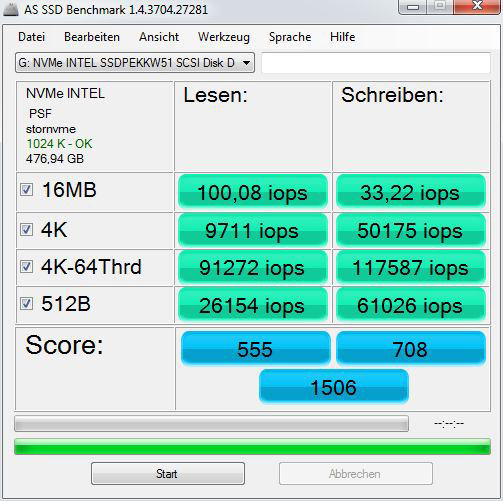
And here is yet a screenshot of AS SSD iops results:
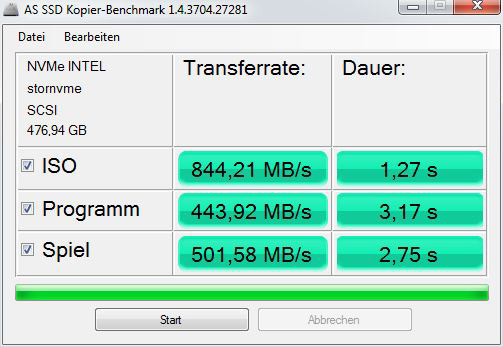
Here is a screenshot of the AS SSD copy benchmark values:
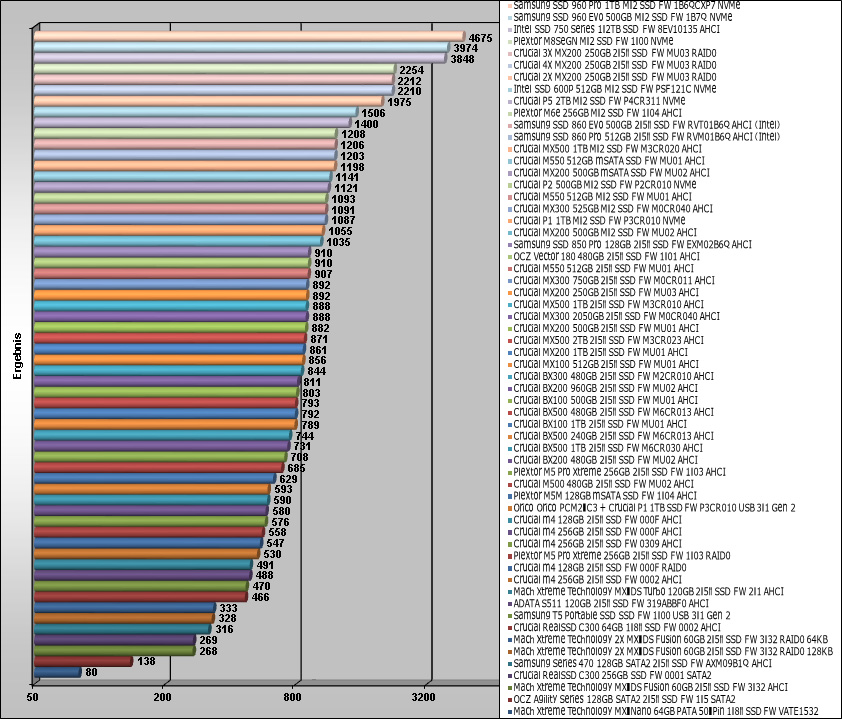
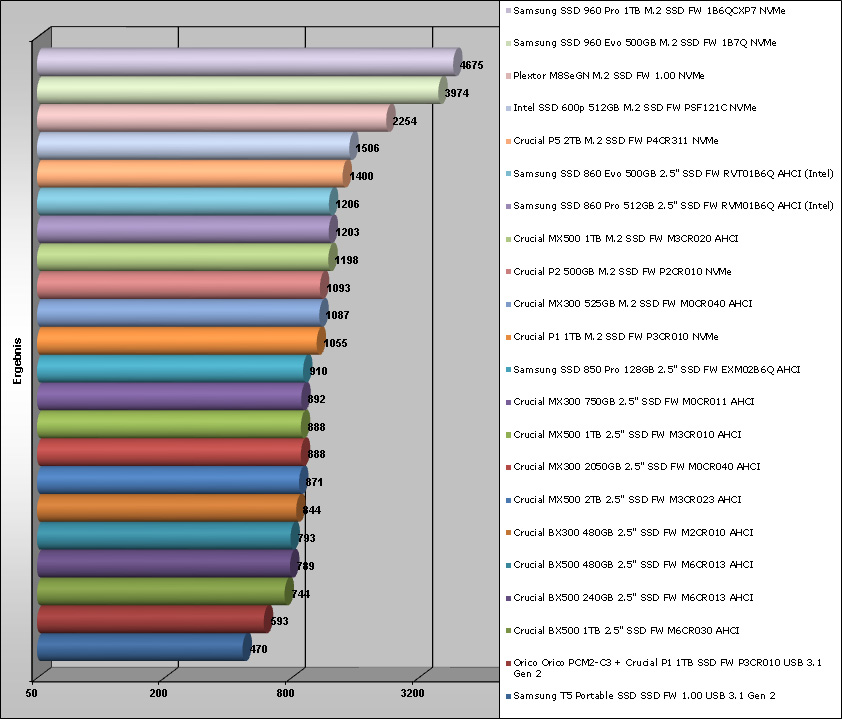
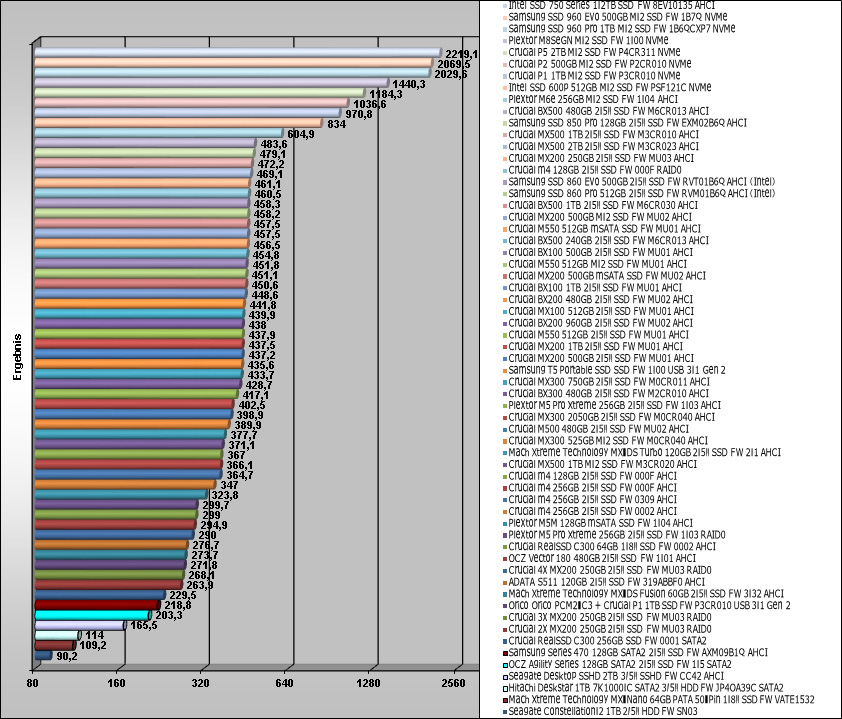
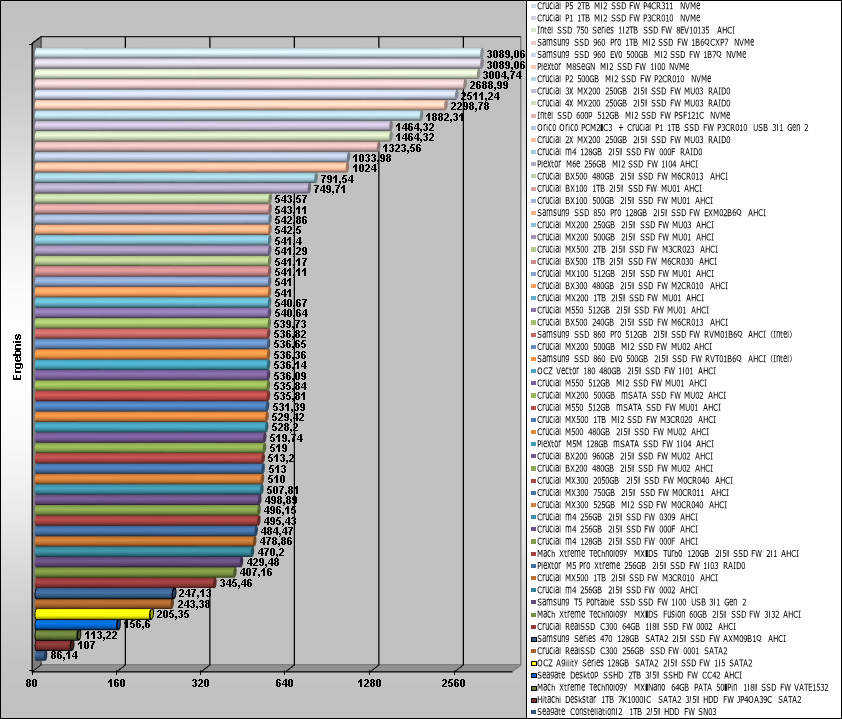
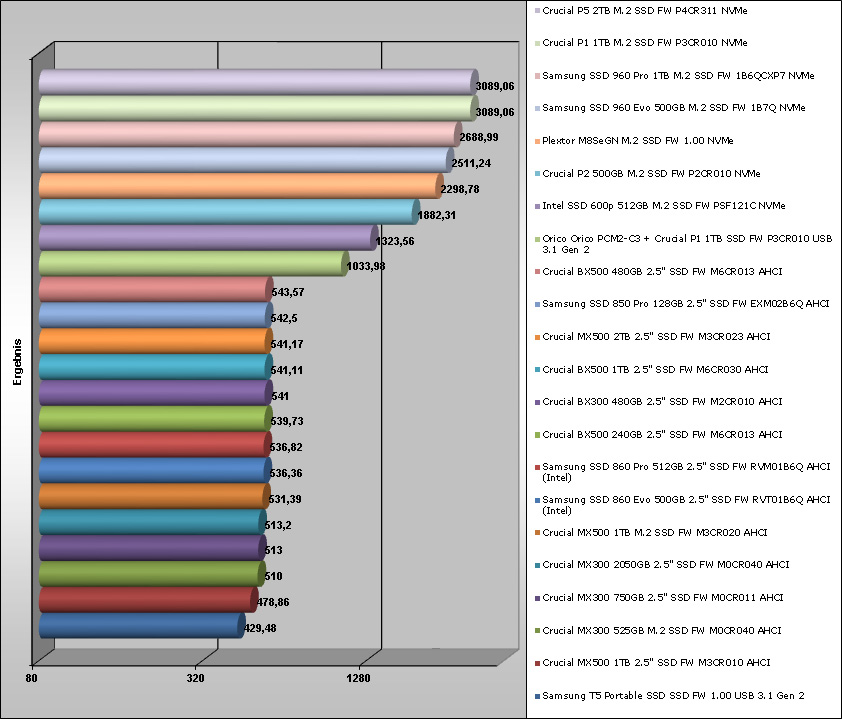
The comparison of the AS SSD benchmark results is extended with each new HDD/SSD test. Here you can see some SSDs in comparison to the Intel 600p 512 GB M.2 NVMe SSD, and the chart will be updated periodically with new SSD drives. At the time of testing, the top of the AS SSD overall score is led by the Samsung 960 Pro 1TB M.2 NMVe SSD, followed by the Samsung 960 Evo M.2 NMVe SSD and the Intel SSD 750 PCIe NMVe SSD card. After the MX200 SSD RAID, the Intel 600p M.2 SSD with 512 GB joins the chart.
Here is a comparison of the AS SSD benchmark values, which are getting updated with new drives:
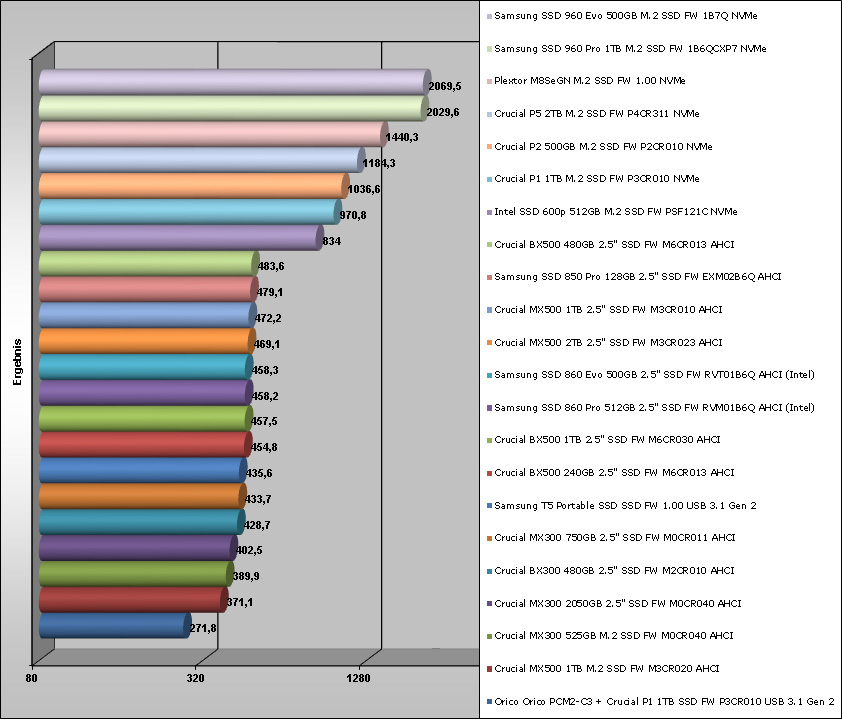
And here is an excerpt of the latest AS SSD benchmark results. For a better overview, they will be gradually replaced with latest drives:
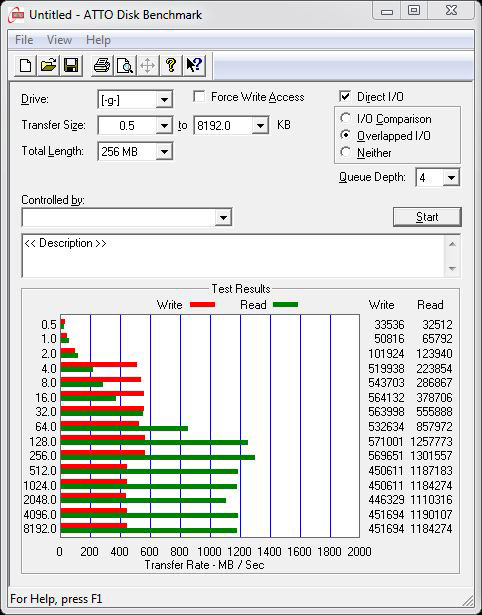
The ATTO disk benchmark values gives a very good overview about the write and read rate on different file sizes. These values are maximum ratings, which are different to the previously continuous transfer rate benchmarks, since this benchmark may even reach a higher overall performance with slower SSDs.
At the Intel 600p 512 GB M.2 NVMe SSD is the read speed (green) from a transfer size of about 64 KB higher than the write speed (red) and reaches the maximum read speed of 1301557 KB at a transfer size of 256 KB. We attribute the relatively unstable result to the TLC NAND and thermal effects.
Here is a screenshot of the ATTO Disk benchmark values:
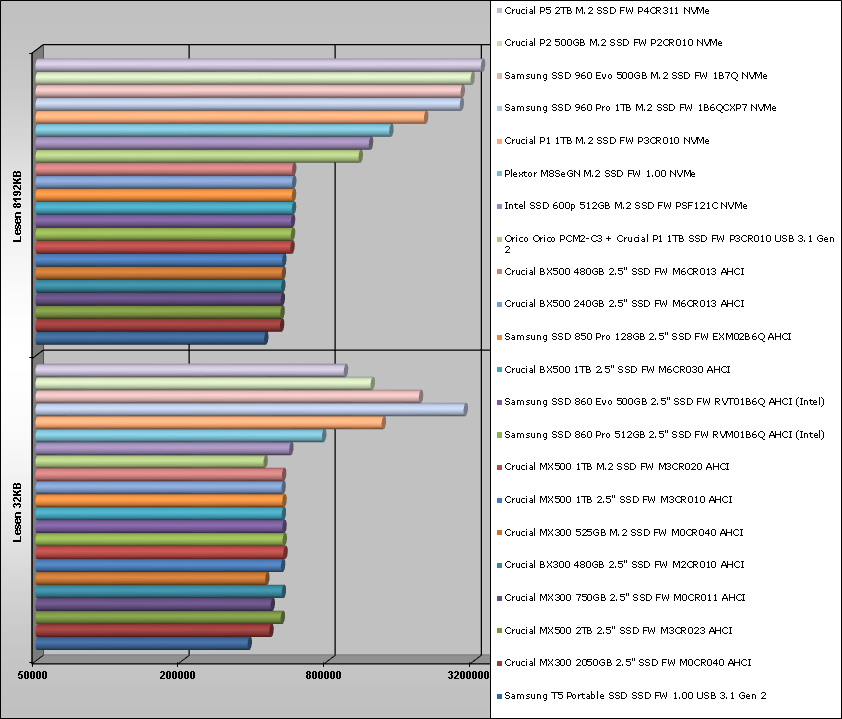
The ATTO disk benchmark values are compared with a small transfer size of 32KB and a large transfer size of 8192KB. The bar chart already includes a comparison to some SSDs and HDDs, where the Intel M.2 NVMe SSD at ATTO is in the upper range.
Here is a comparison of the ATTO disk benchmark values, which are getting updated with soon coming drives:
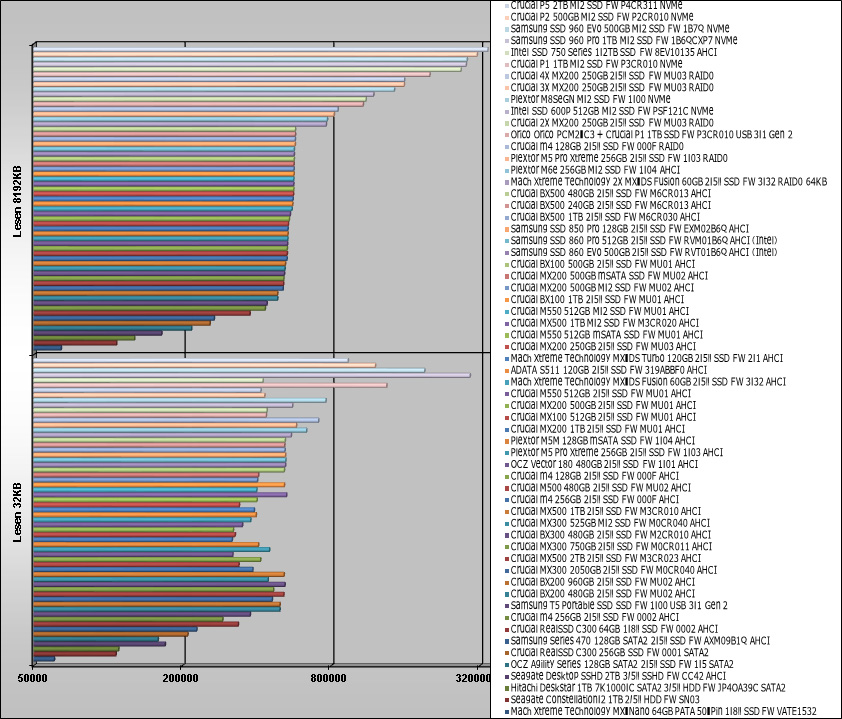
And here is an excerpt of the latest ATTO disk benchmark values for a better overview will be gradually replaced with latest drives:
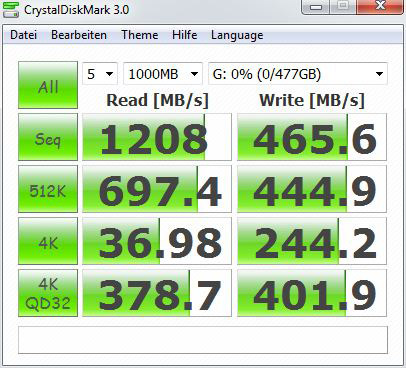
With CrystalDiskMark one receives a balanced measurement of the performance with different transfer sizes.
Here the Intel 600p 512GB M.2 PCIe Gen 3 x4 NVMe SSD achieves sequential read values of 1208 MB/s and write values of 465.6 MB/s.
Here is a screenshot of the CrystalDiskMark values:
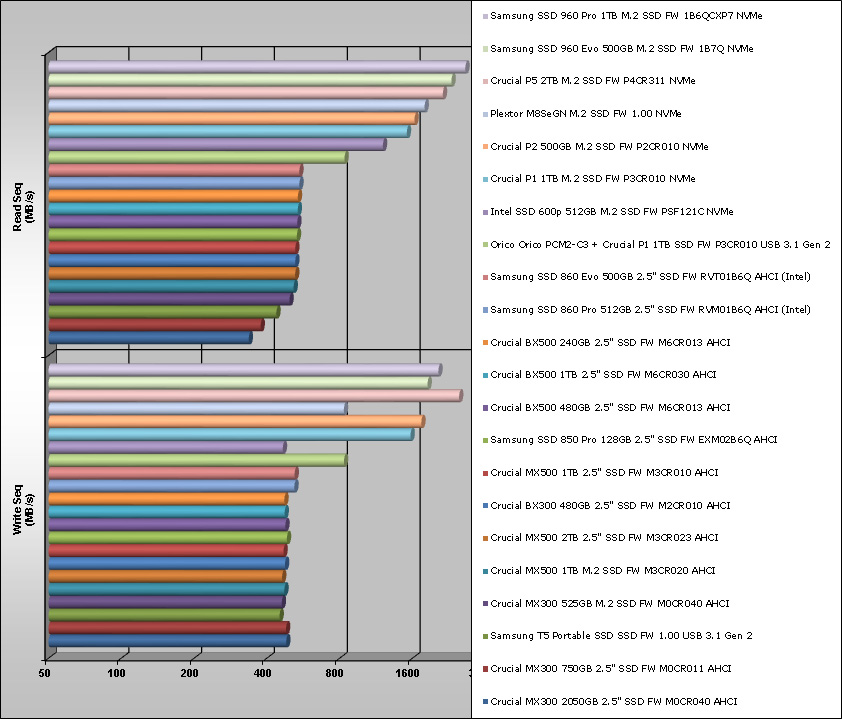
The following diagram shows the CrystalDiskMark results once again compared with other SSDs and platter drives, which are extended step by step. In the CrystalDiskMark comparison one can see significant differences between the to-date tested of the Solid State Drives and Hard Disk Drives.
Here is a comparison of the CrystalDiskMark values, which are getting updated with soon coming drives:
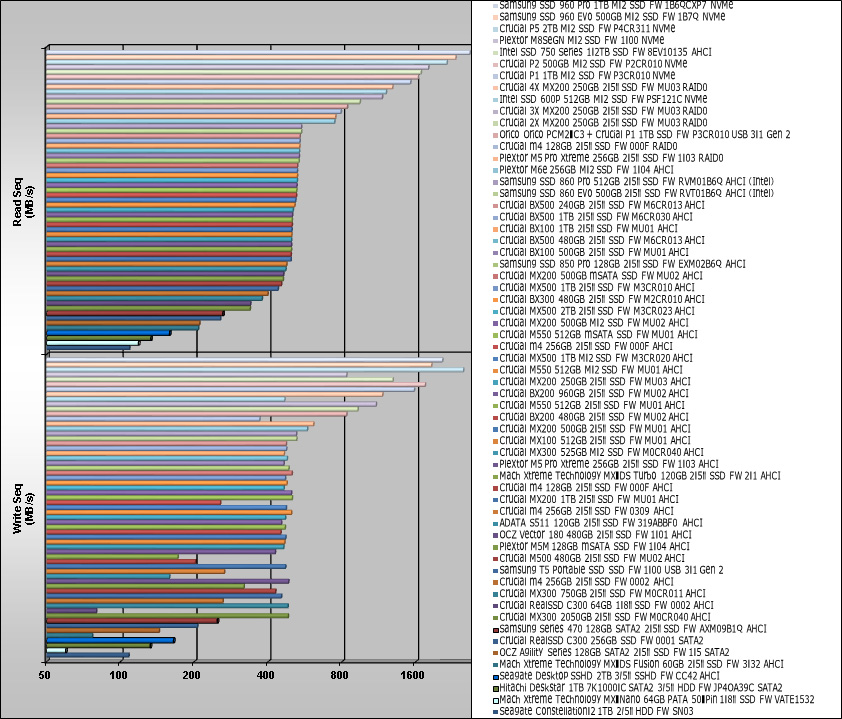
And here is an excerpt of the latest CrystalDiskMark values will be gradually replaced with latest drives for clarity:
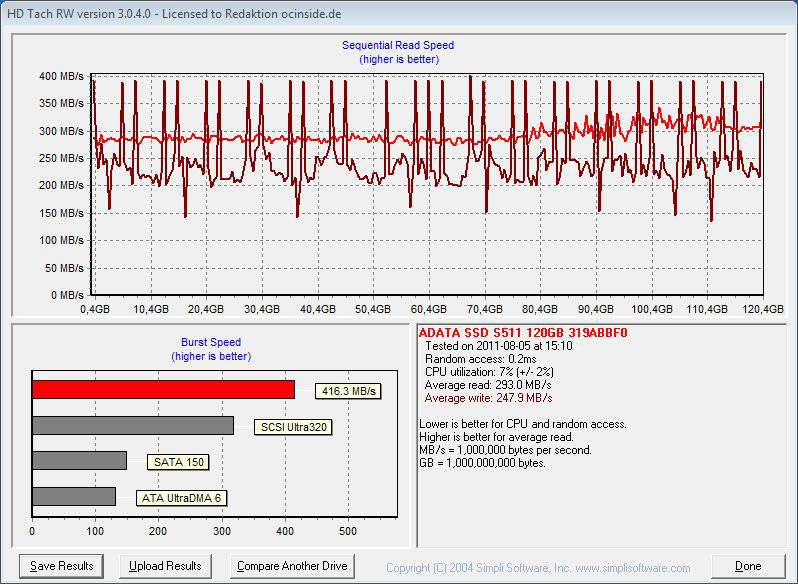
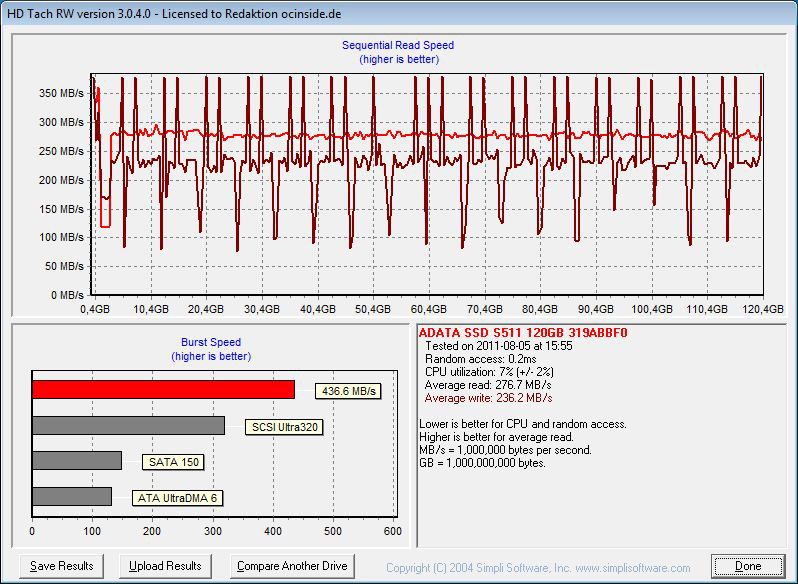
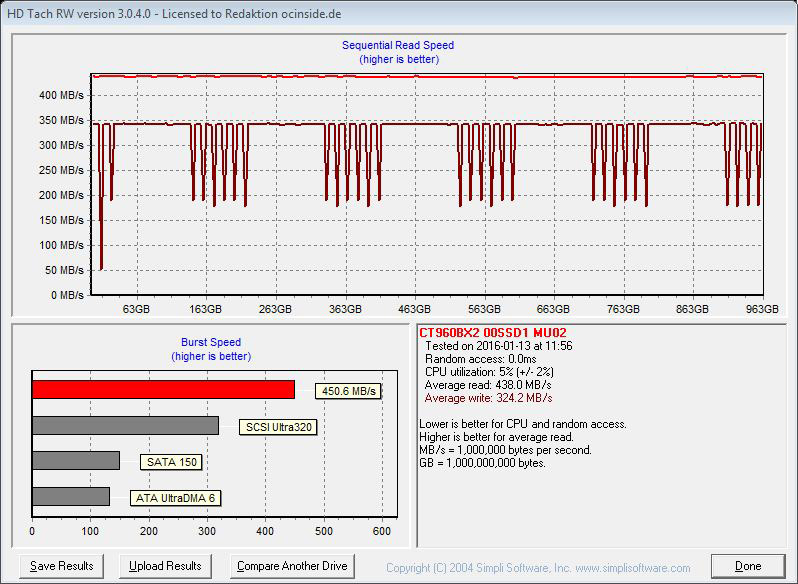
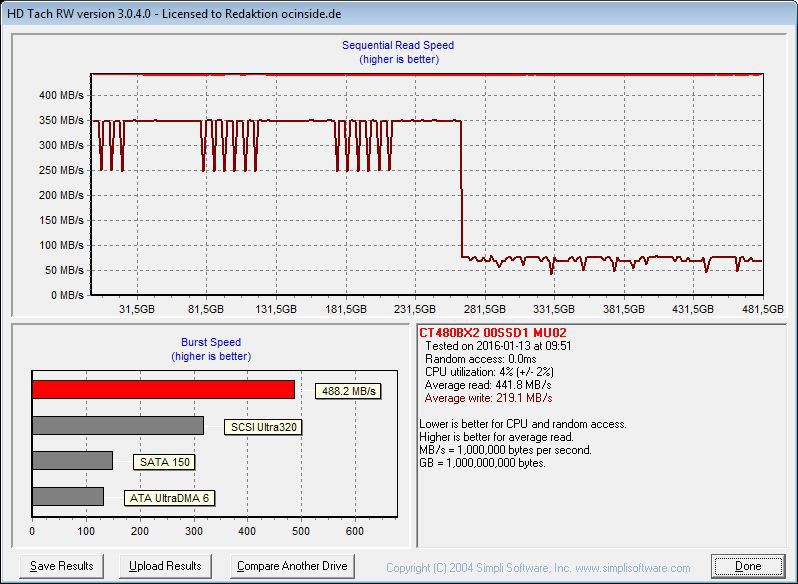
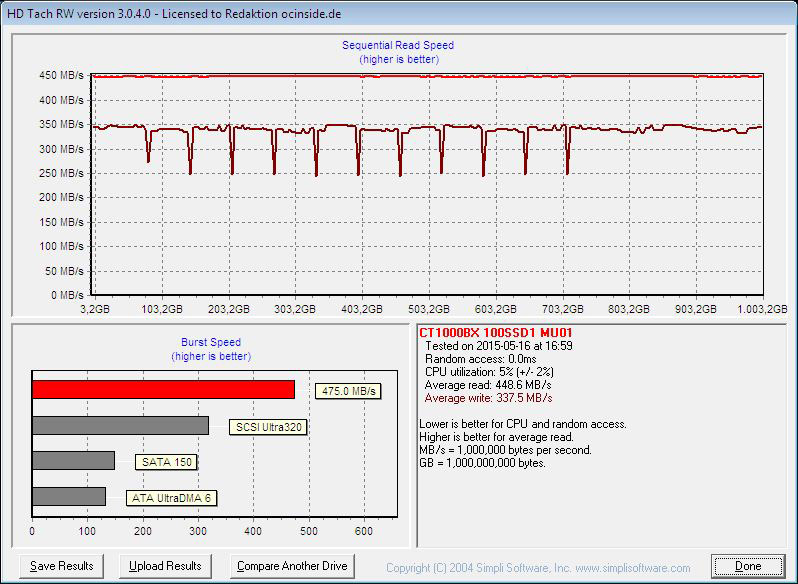
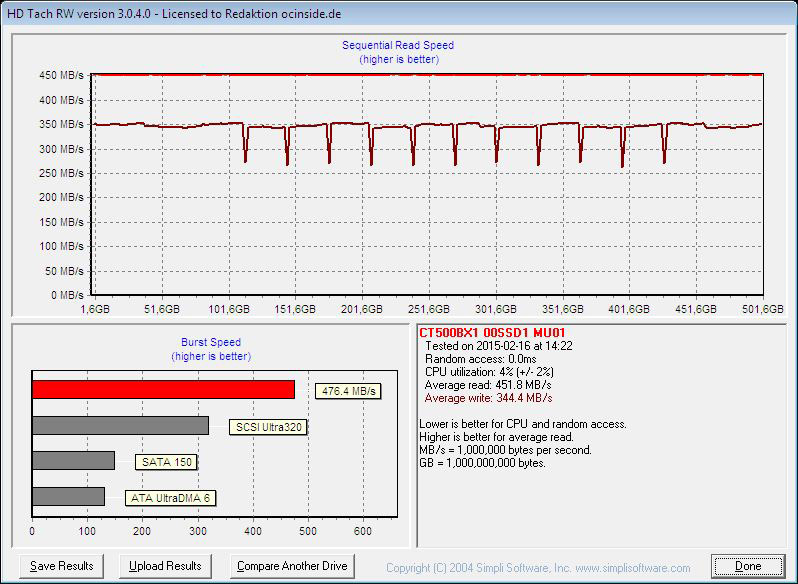
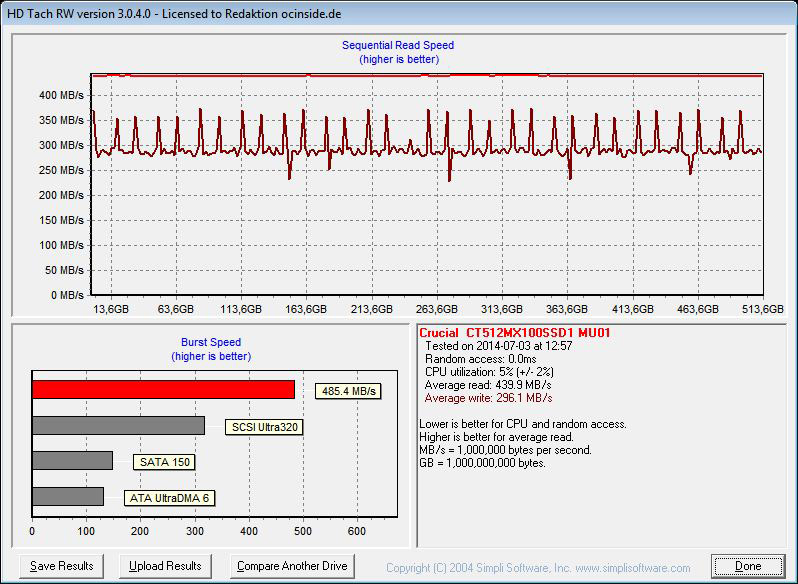
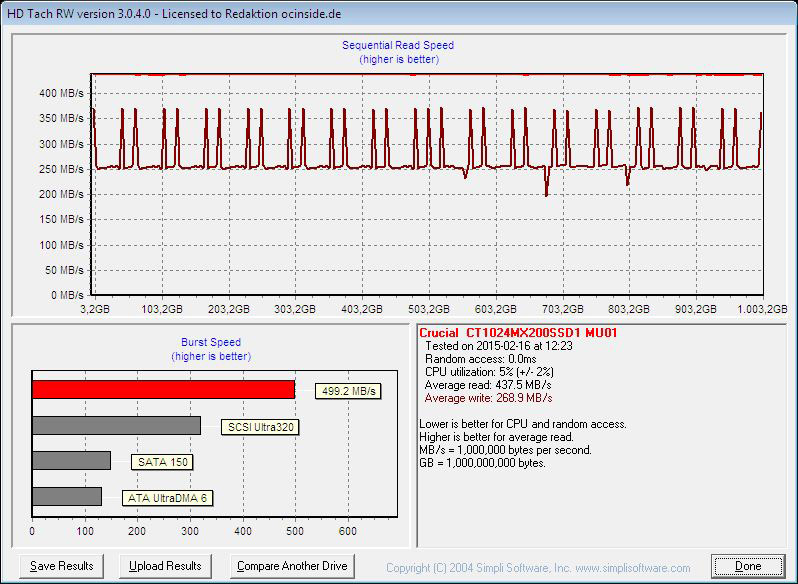
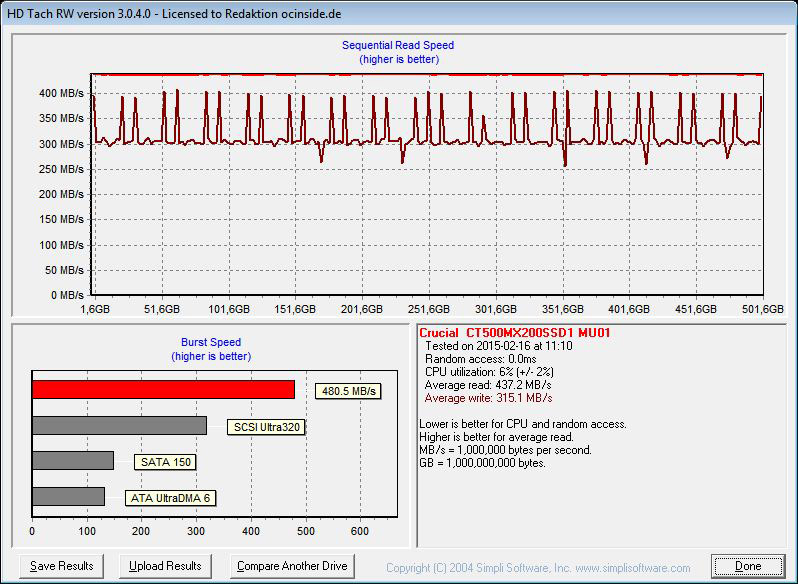
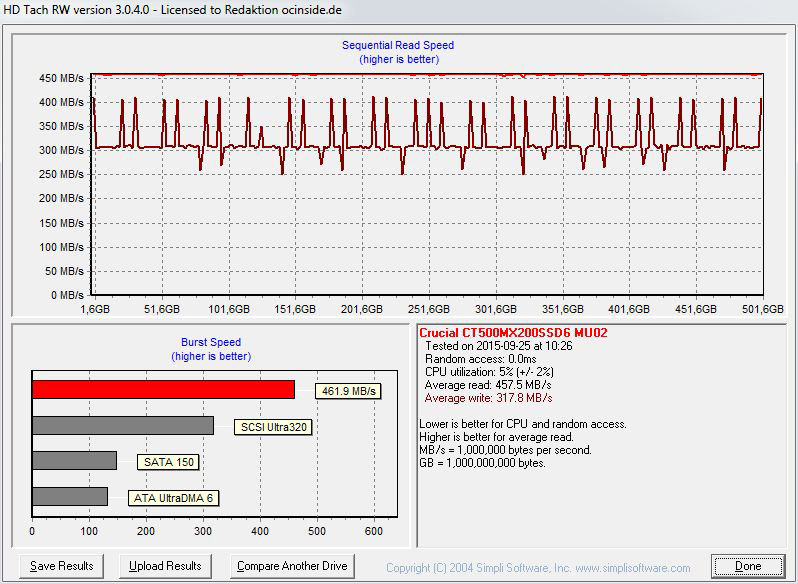
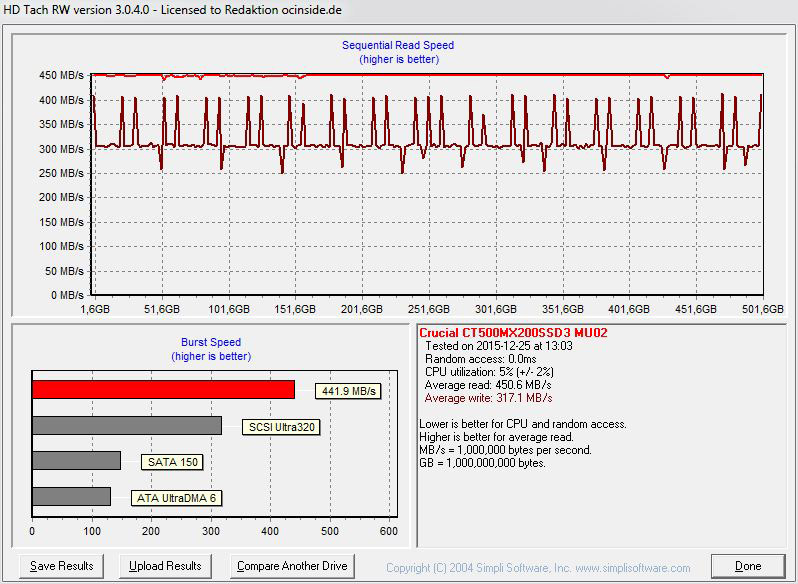
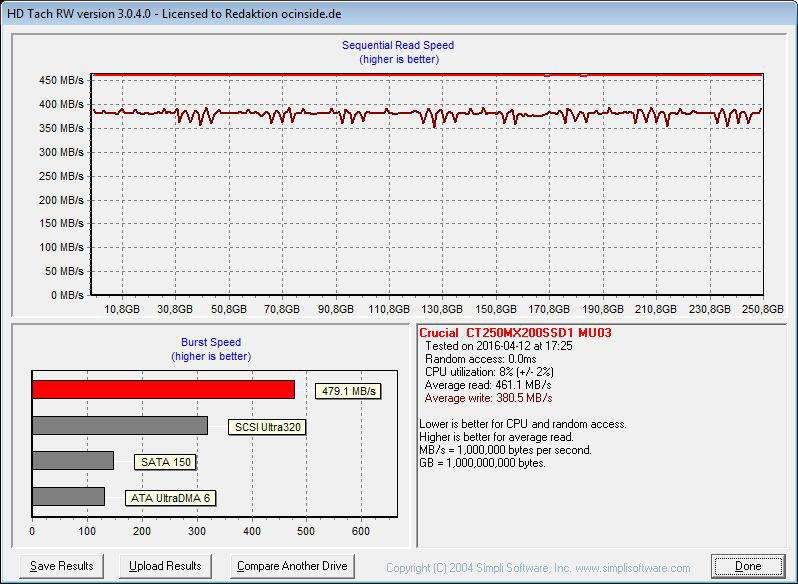
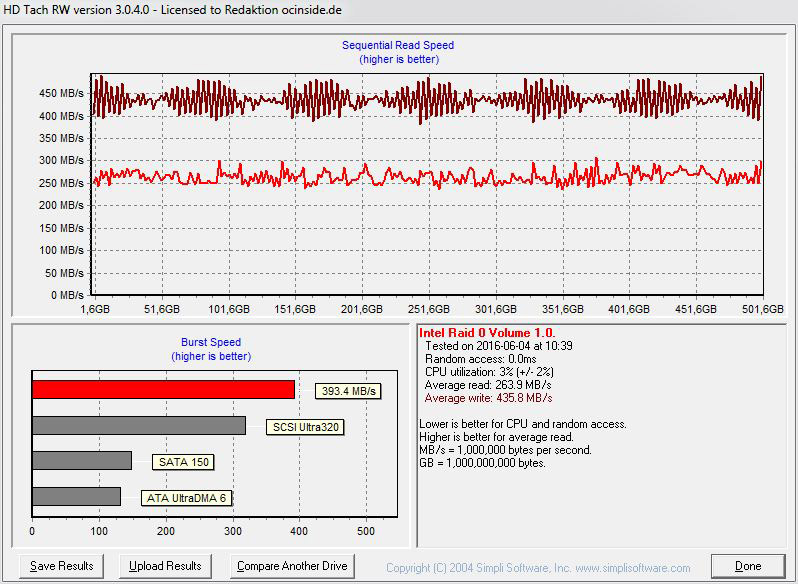
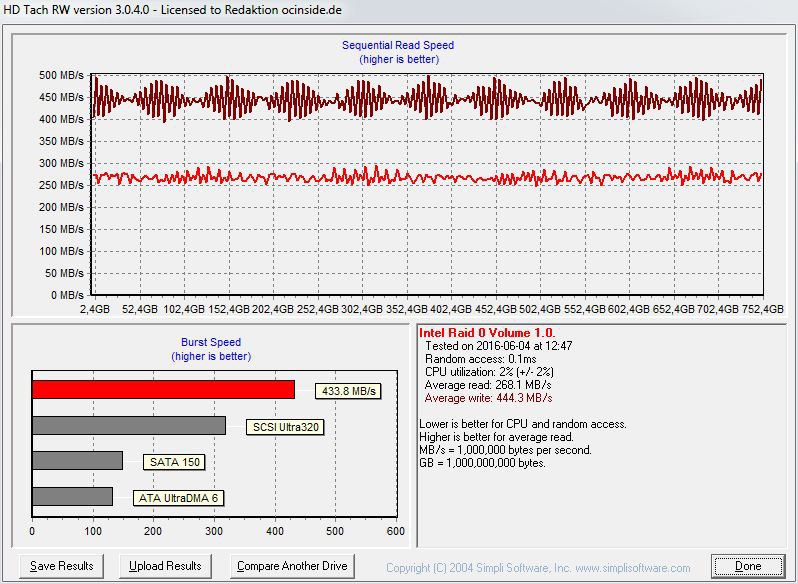
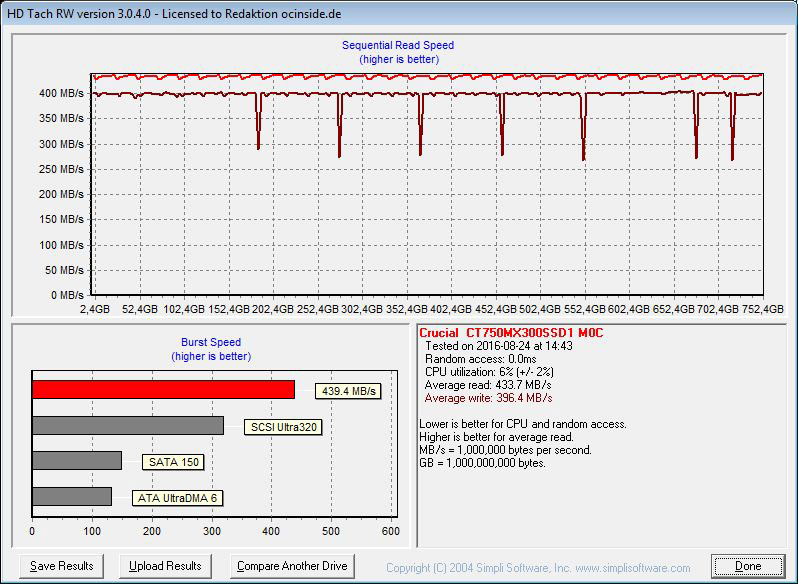
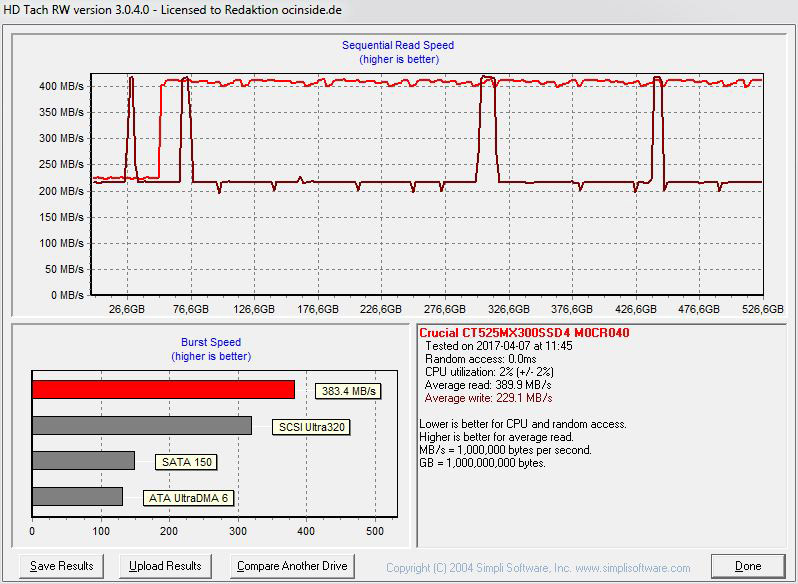
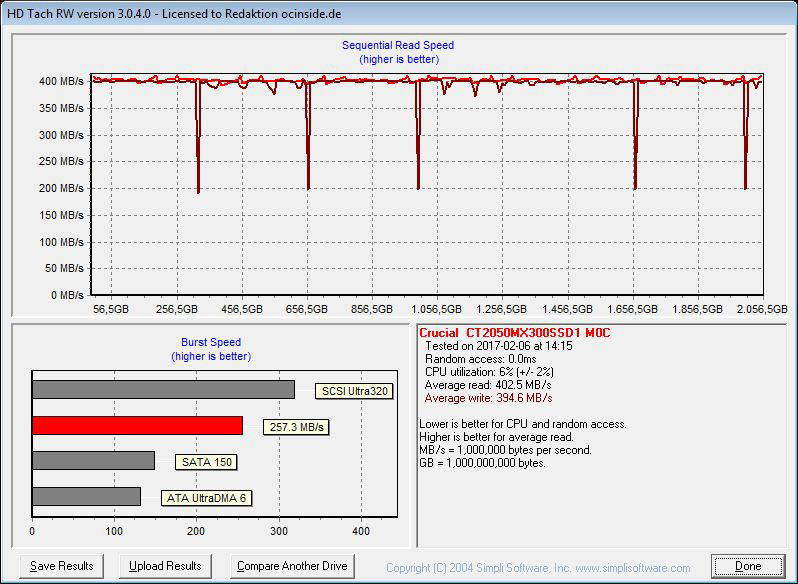
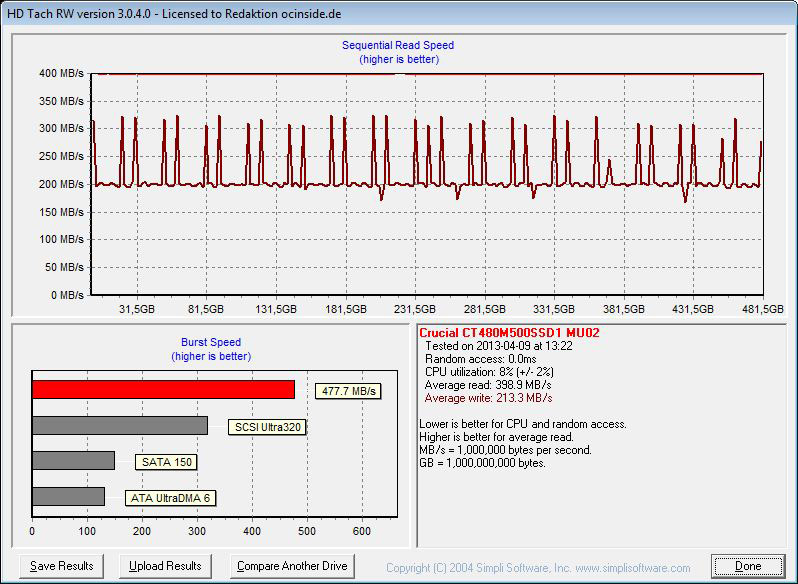
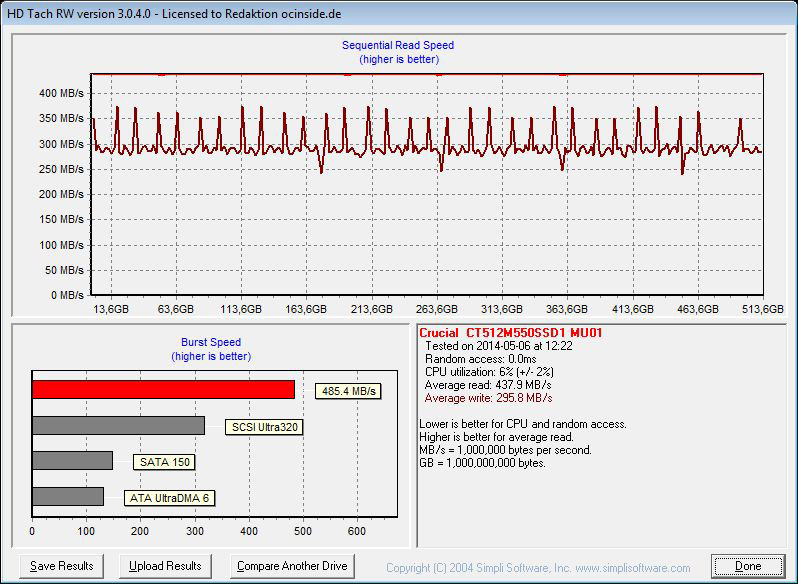
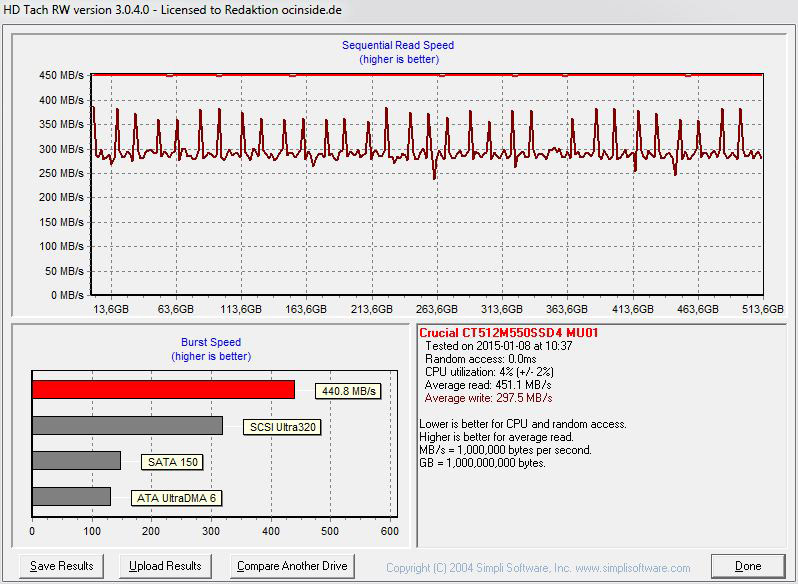
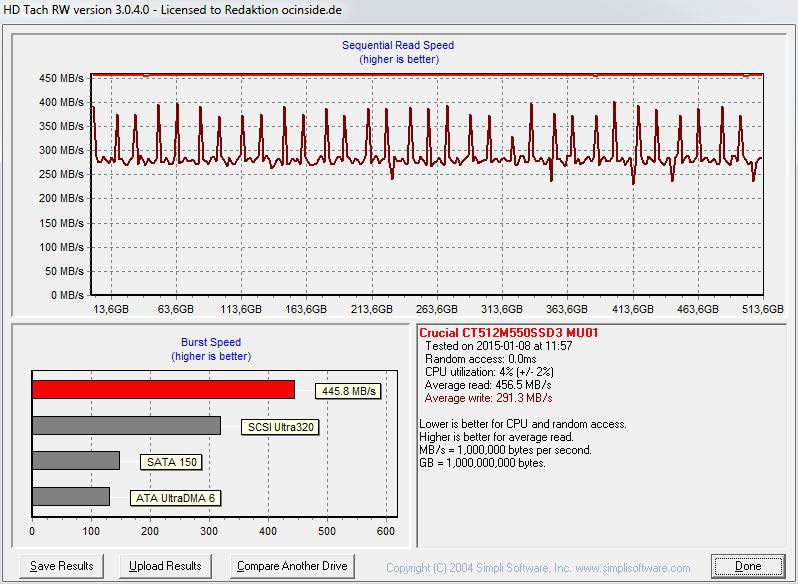
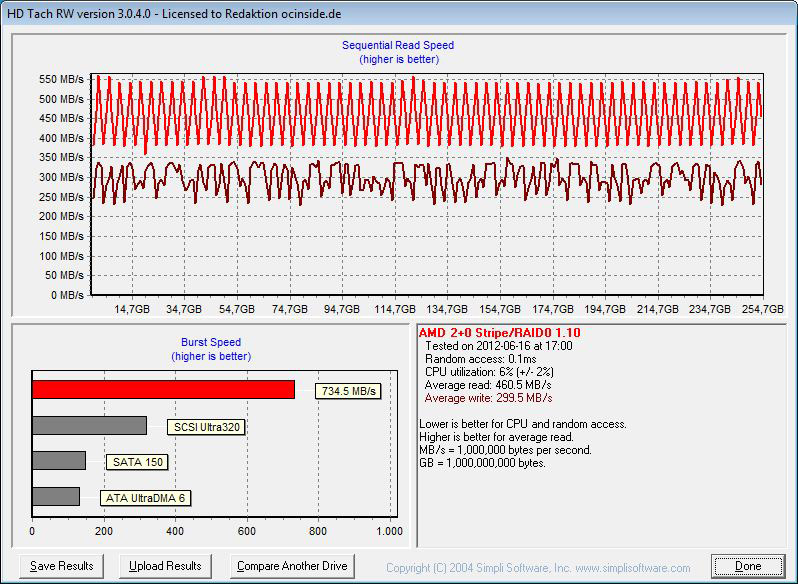
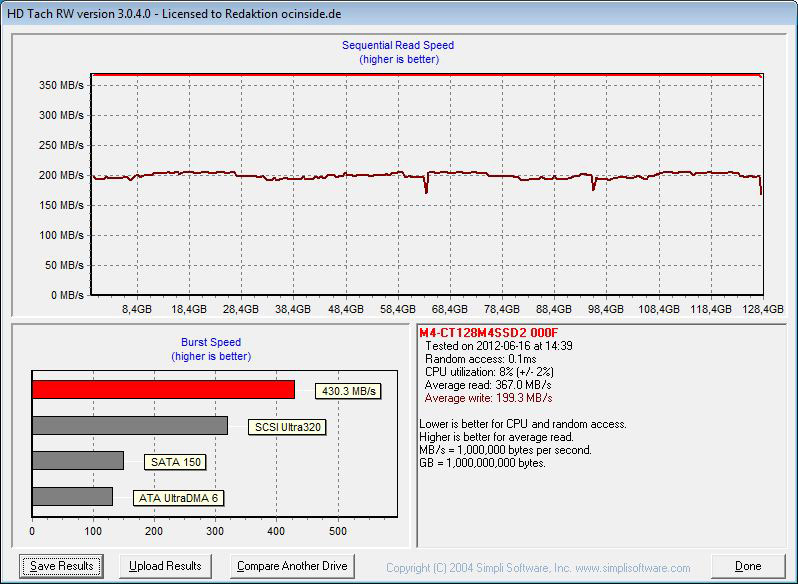
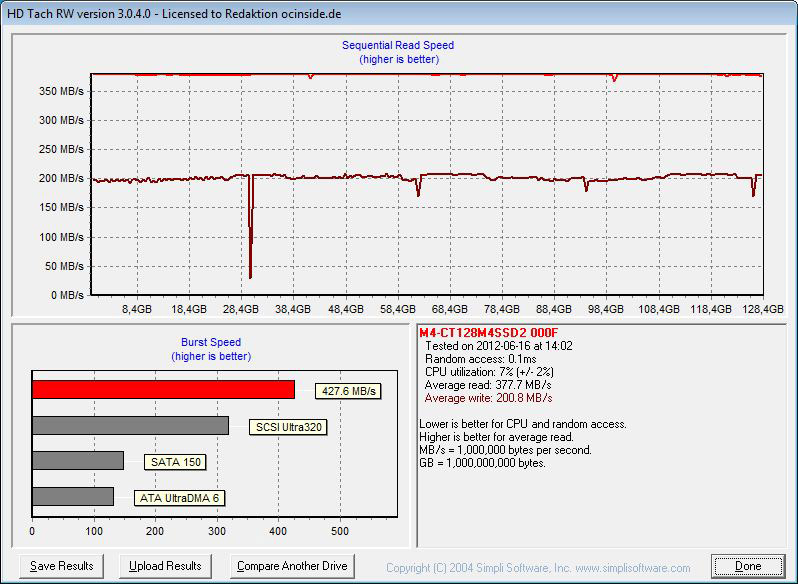
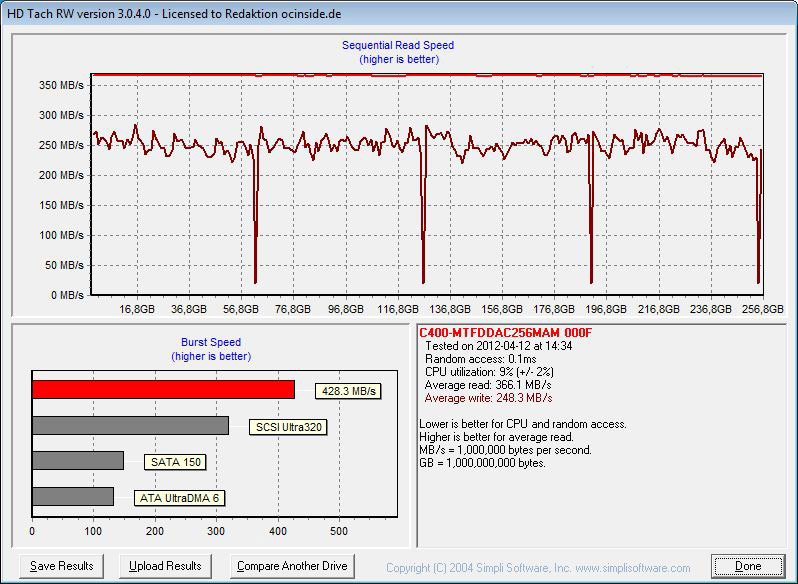
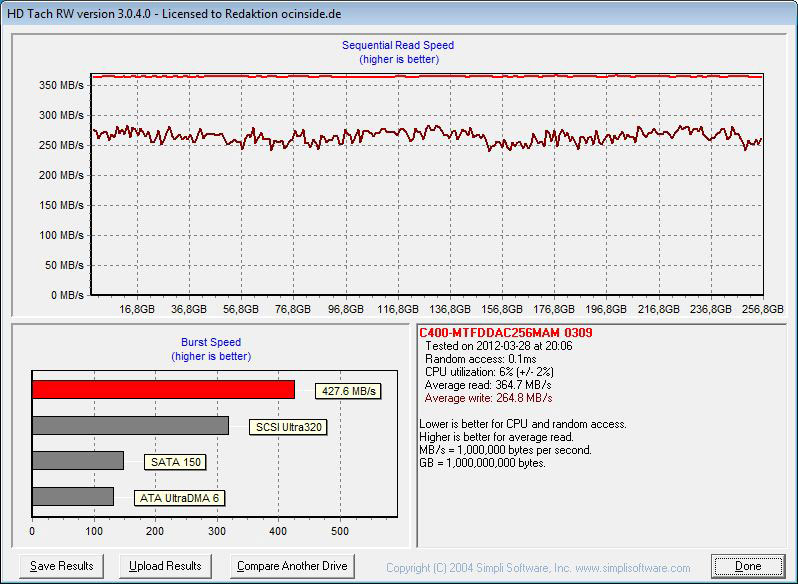
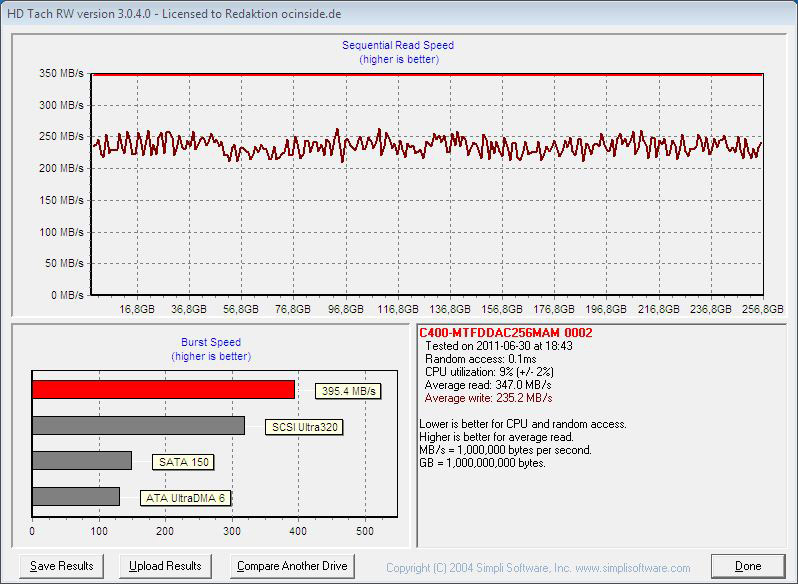
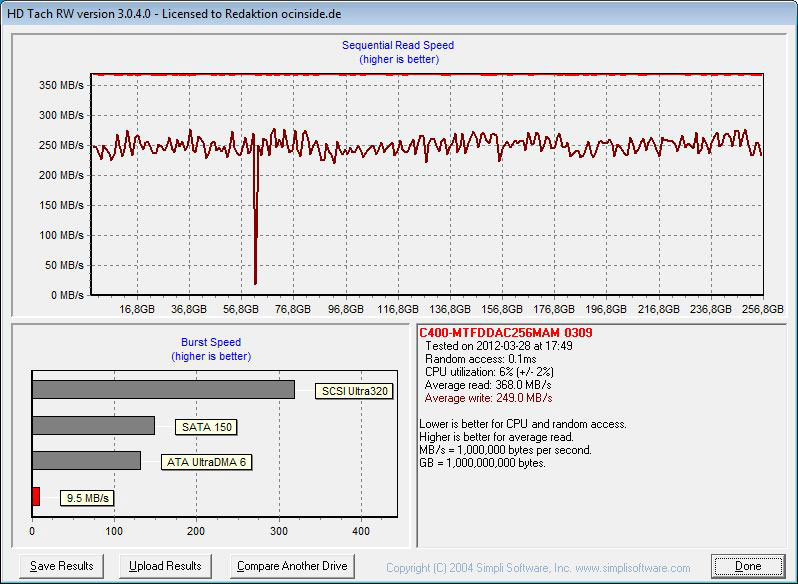
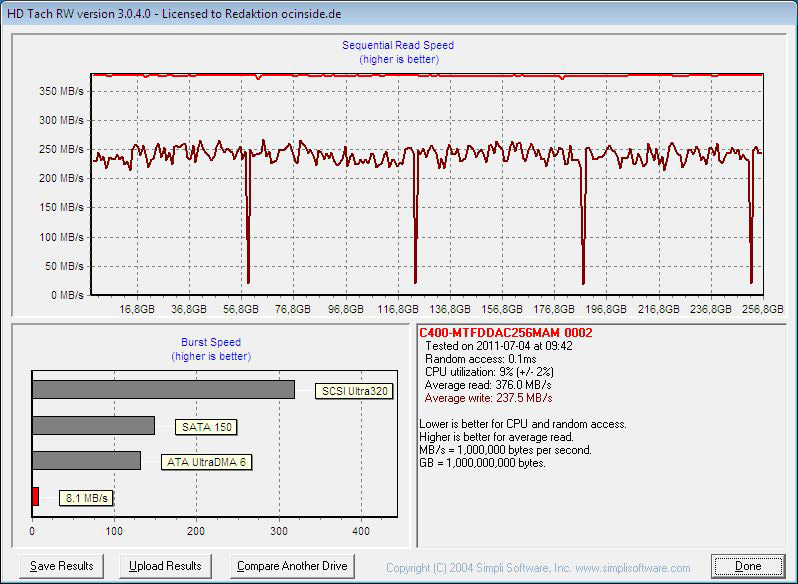
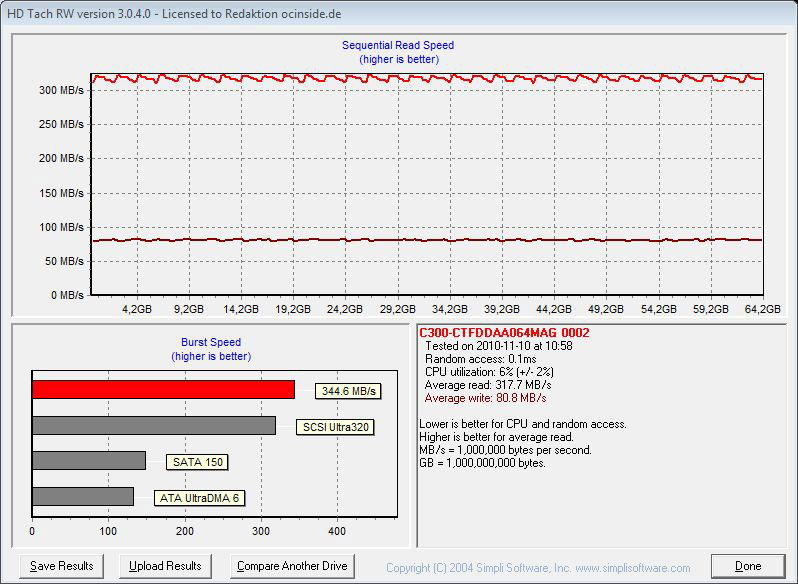
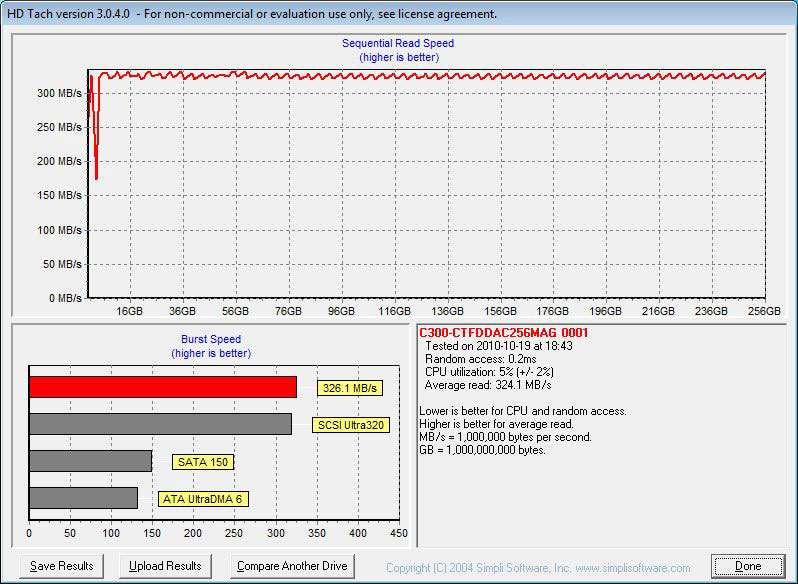
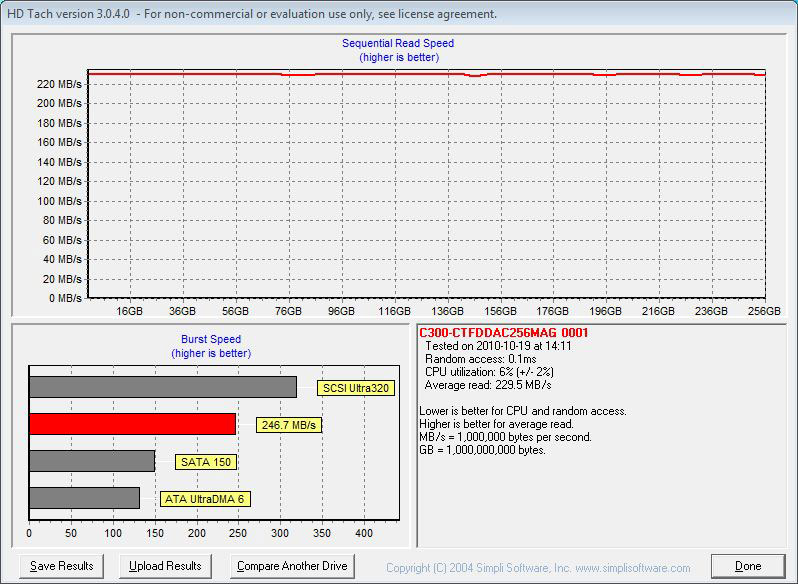
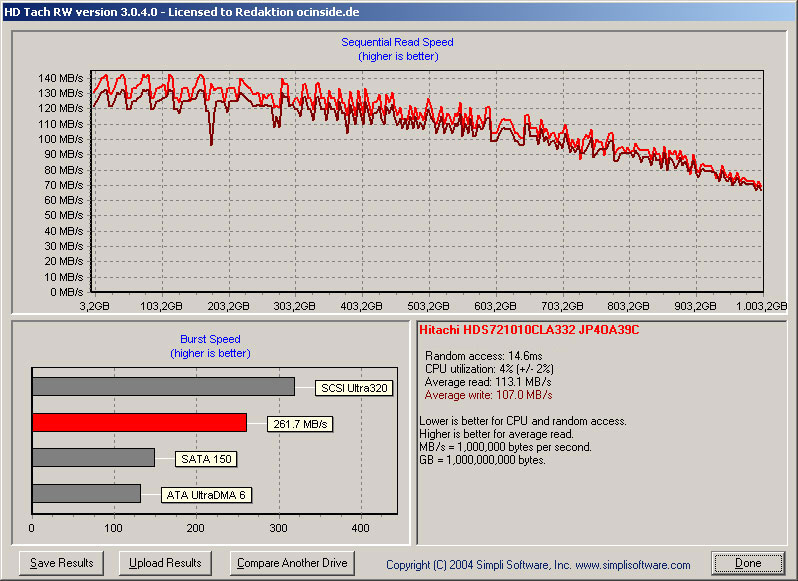
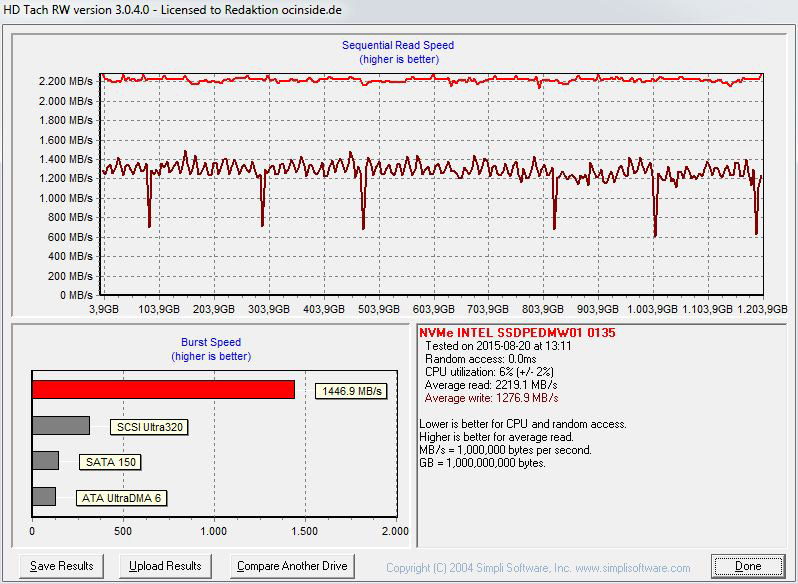
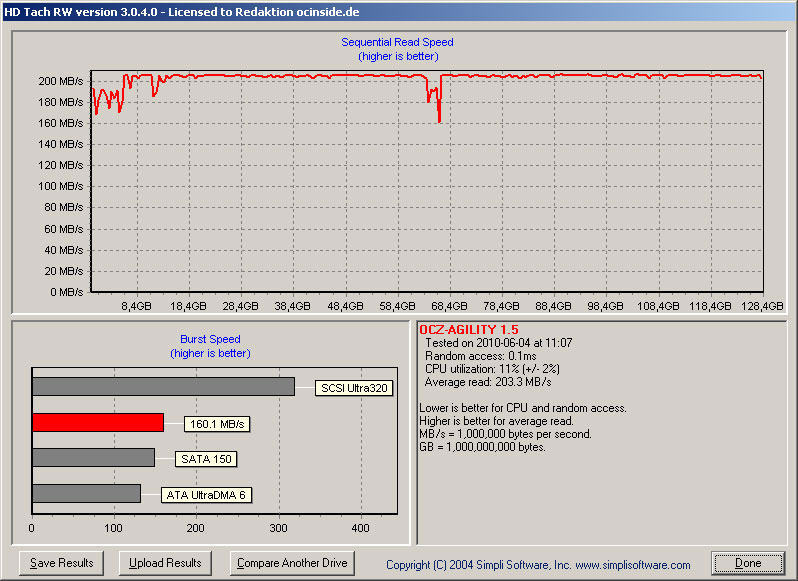
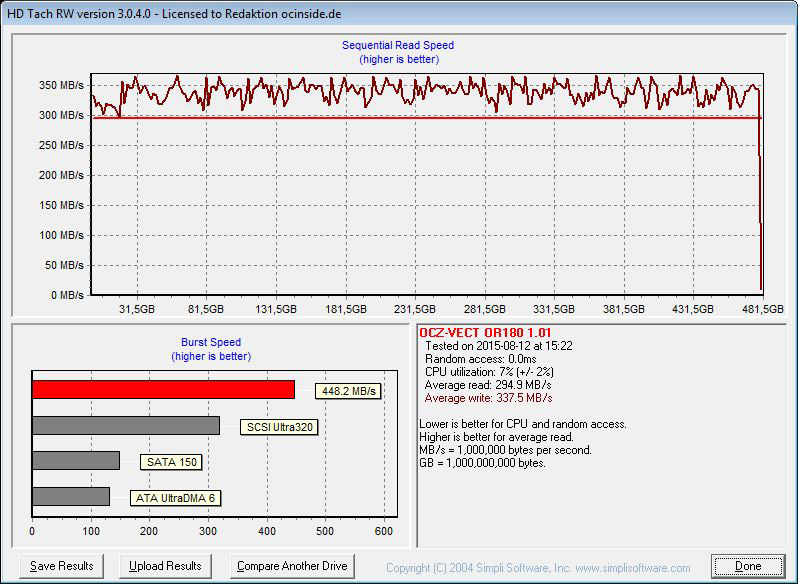
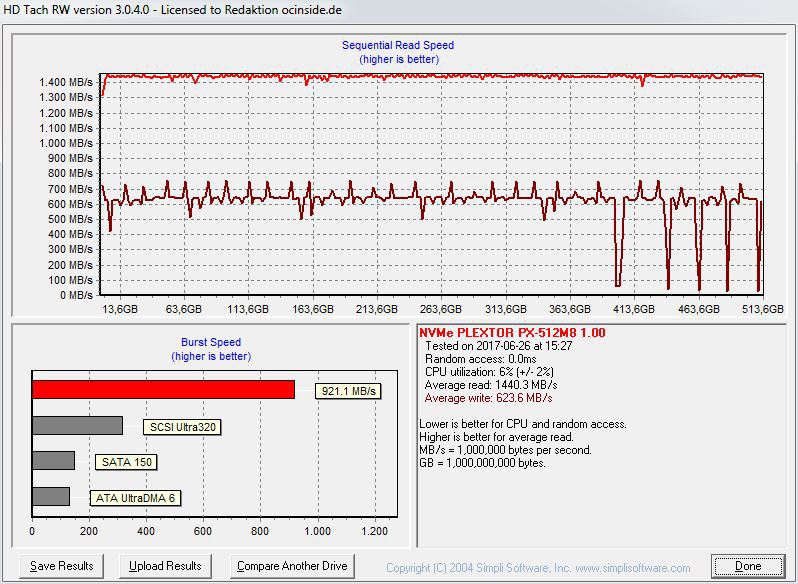
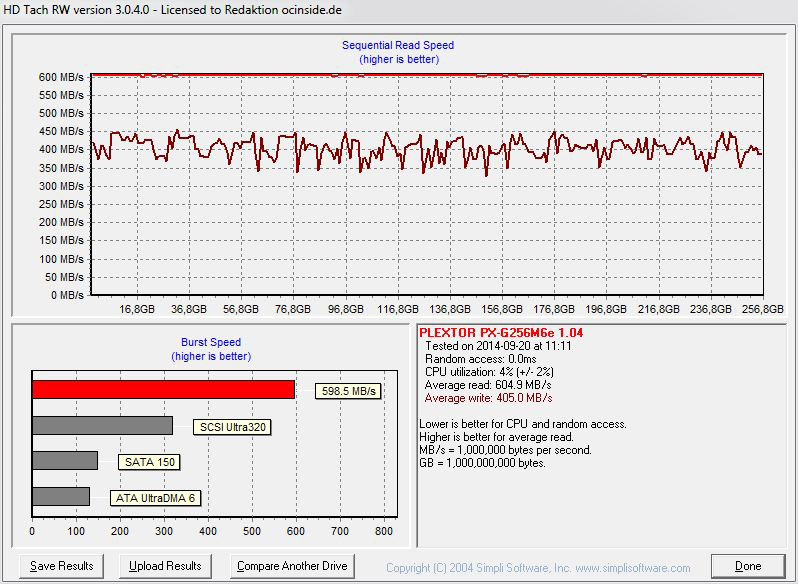
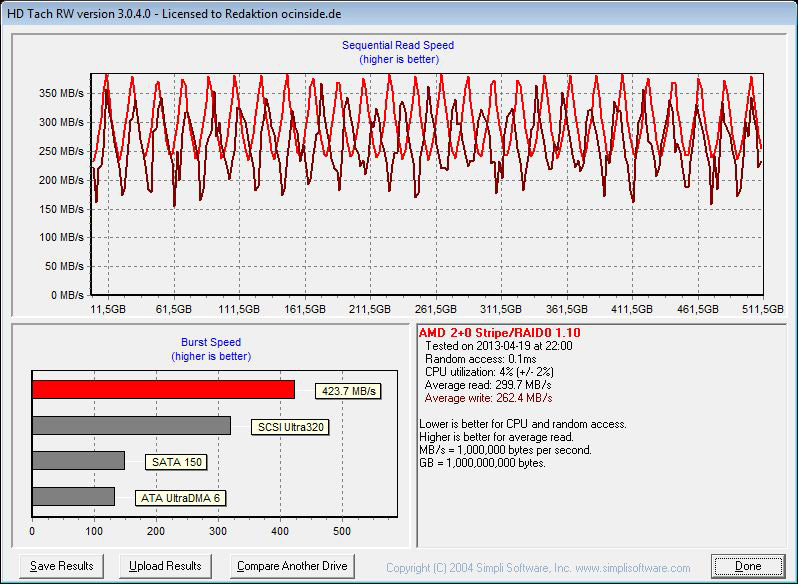
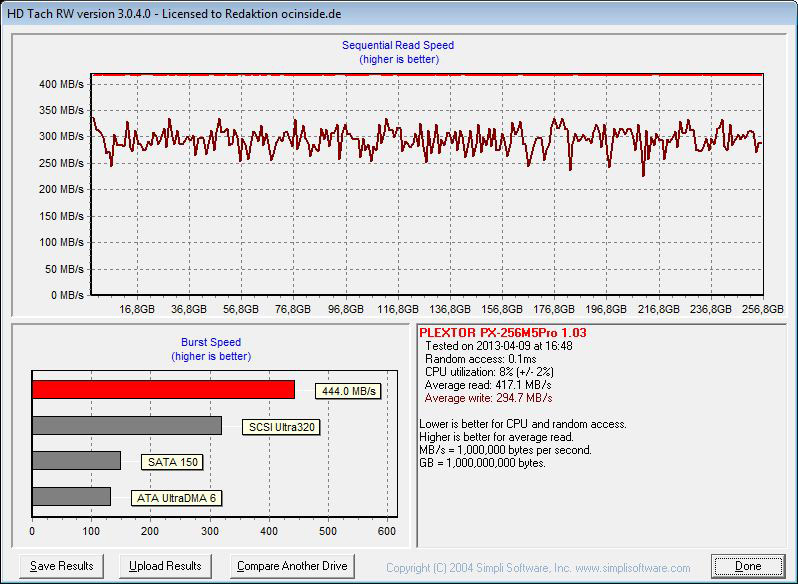
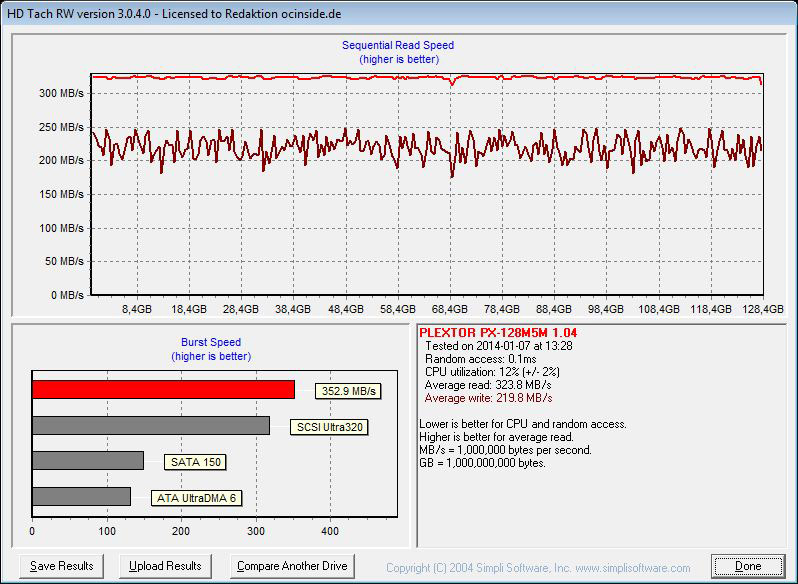
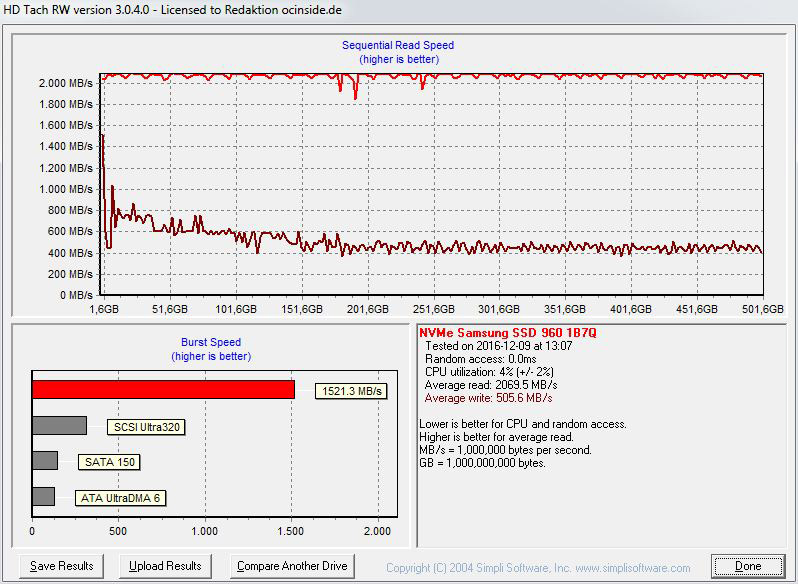
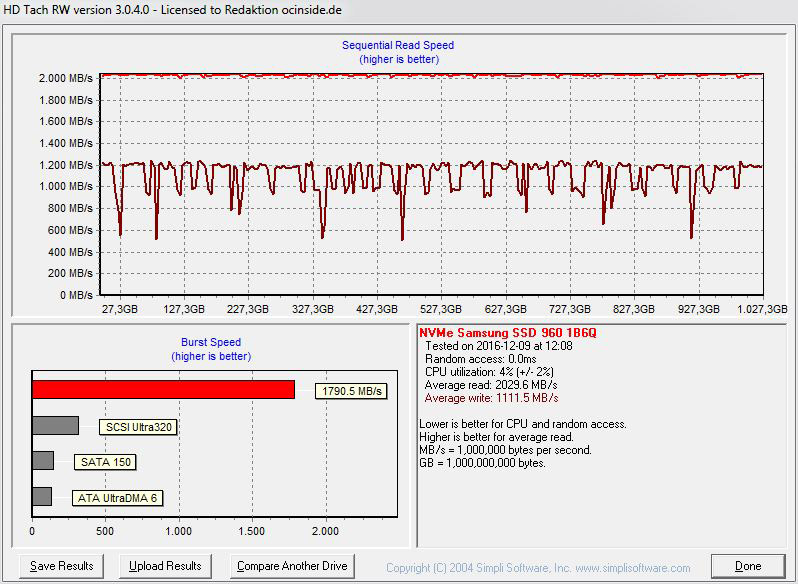
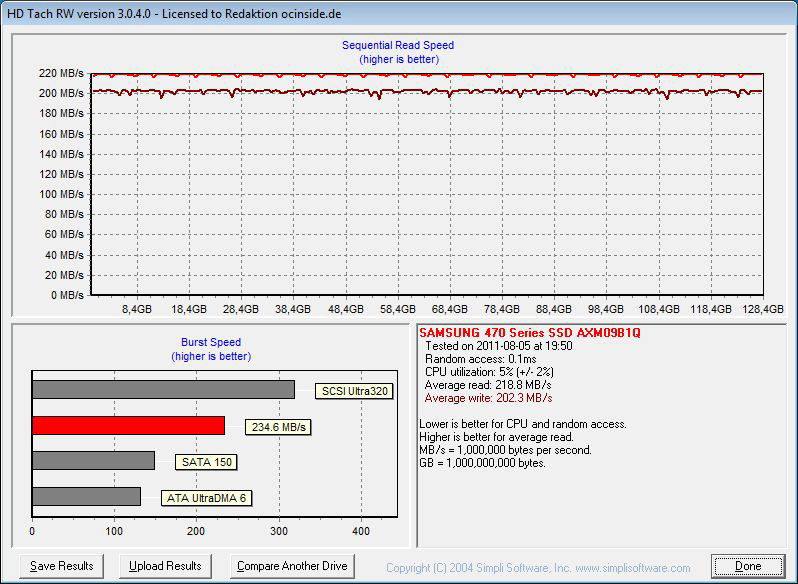
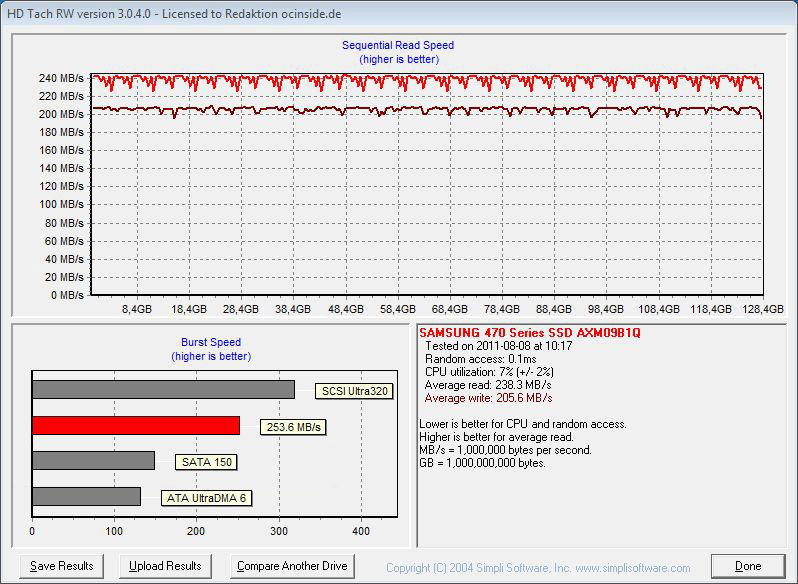
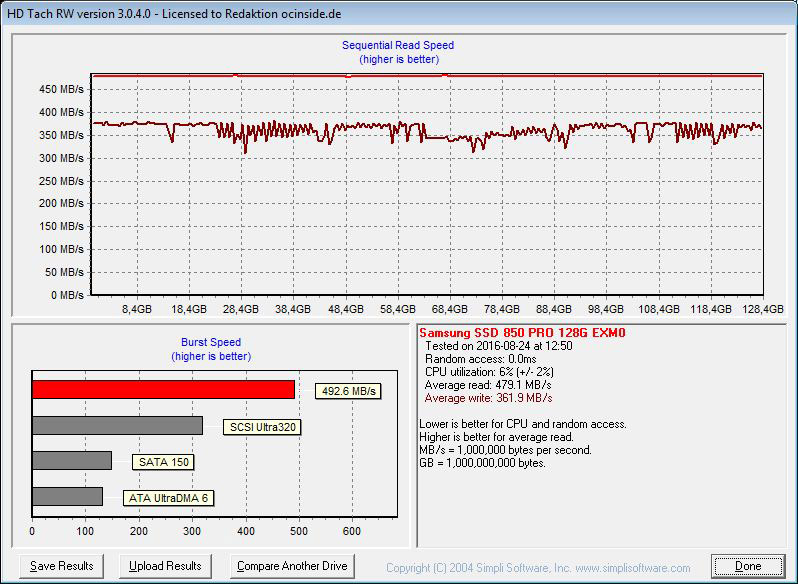
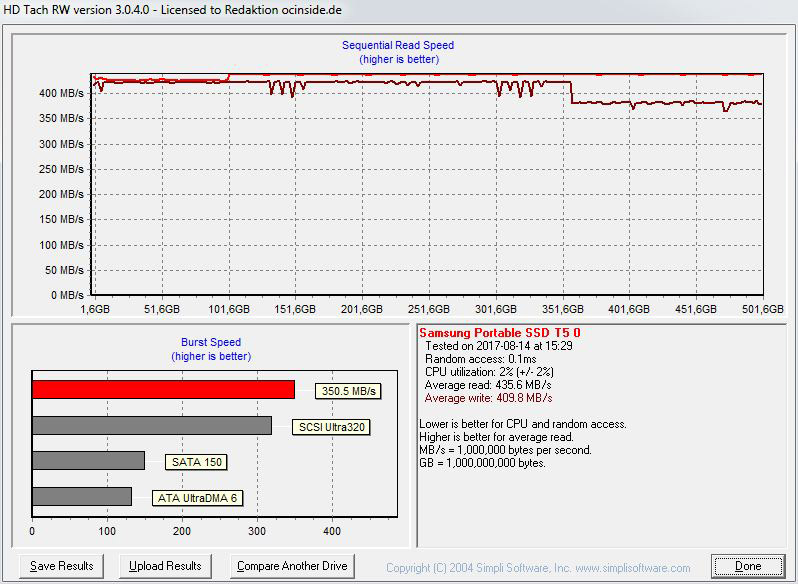
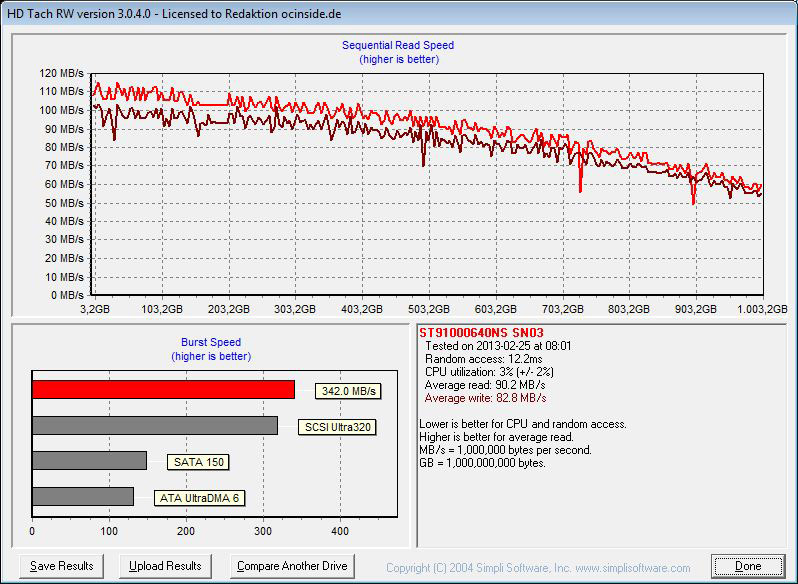
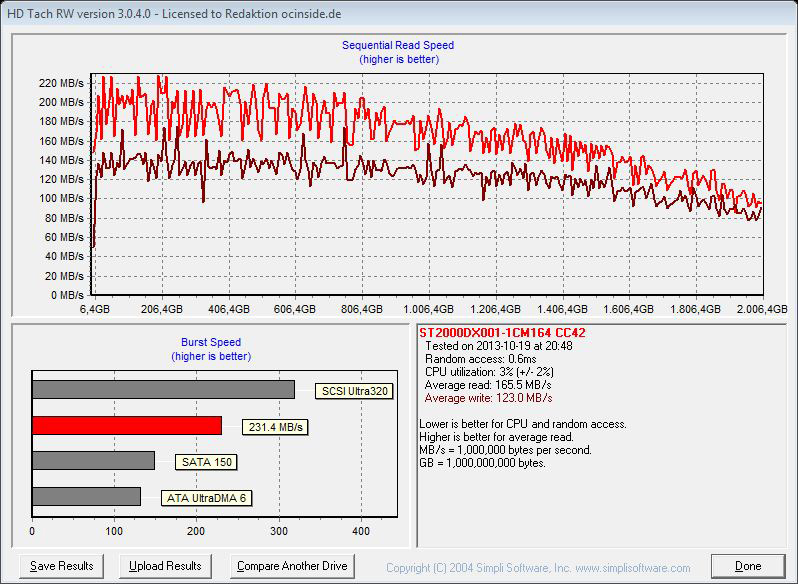
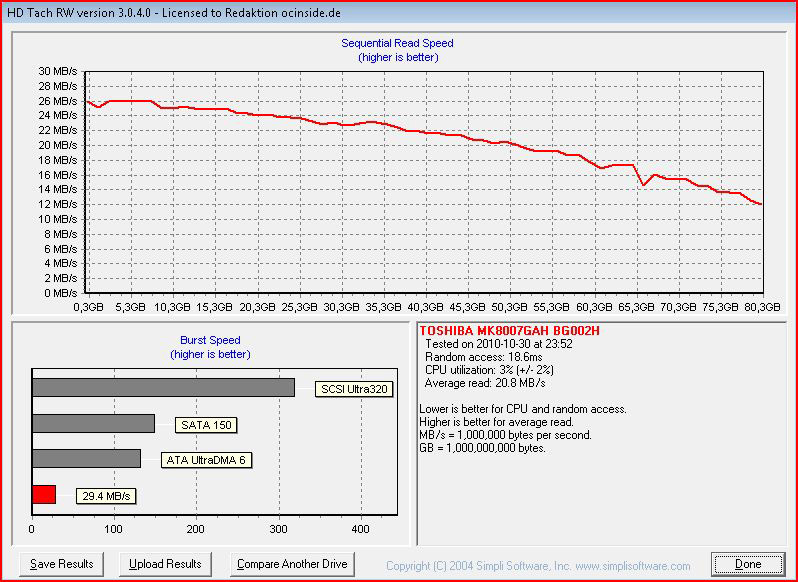
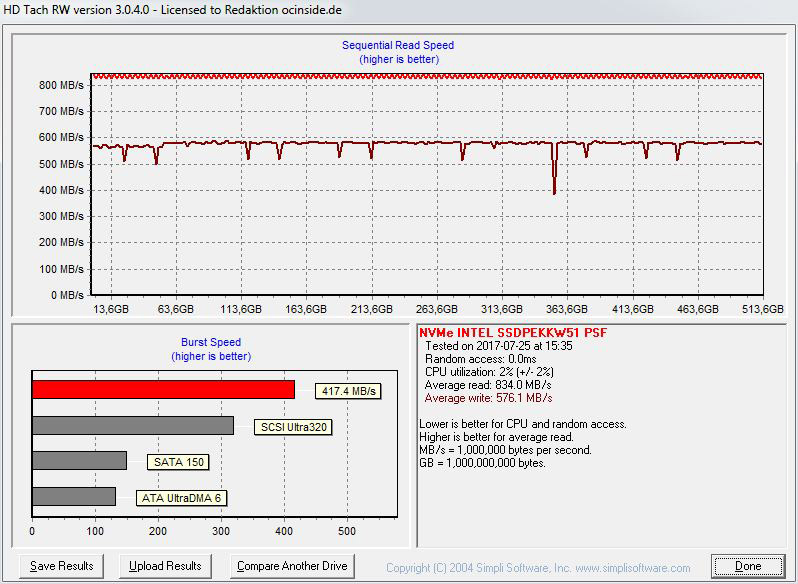
With HD Tach one can measure the gradient of the performance, but the SSD transfer is not comparable with a conventional HDD. New logical NAND cell access of the SSD controller results like some other equal designed SSDs in varying rates with the latest HD Tach Version 3.0.4.0 version, which is designed for hard disk drives.
HD Tach shows with the Intel 512 GB 600p M.2 SSD a usual continuous read rate with the lowest displayed access time display of approx. 0.0ms. There are also hardly any peaks during the write process, at least in the long benchmark.
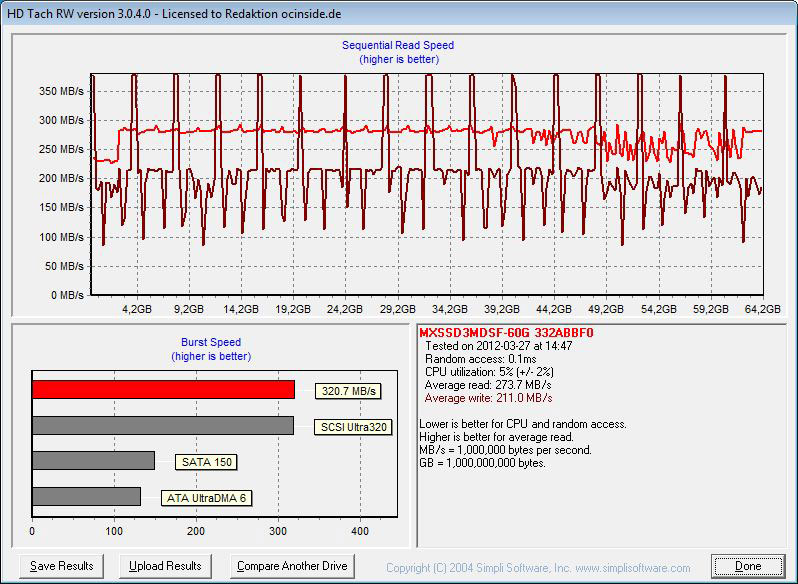
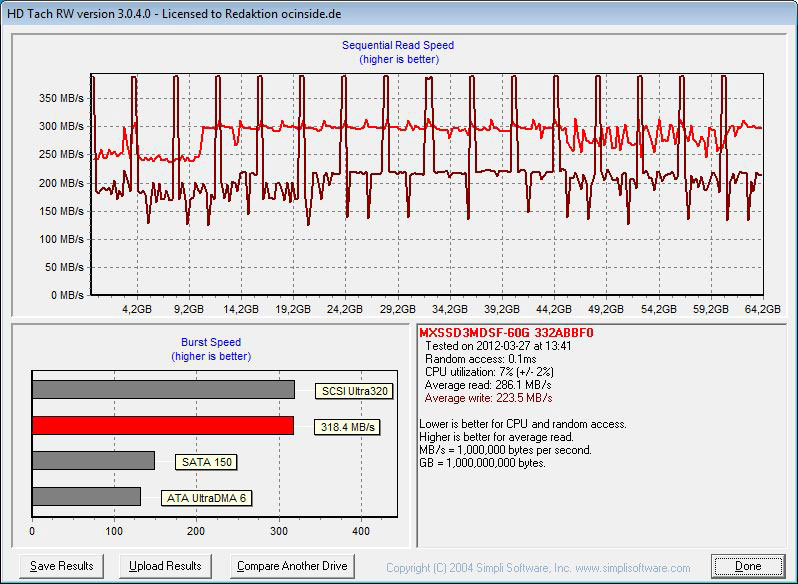
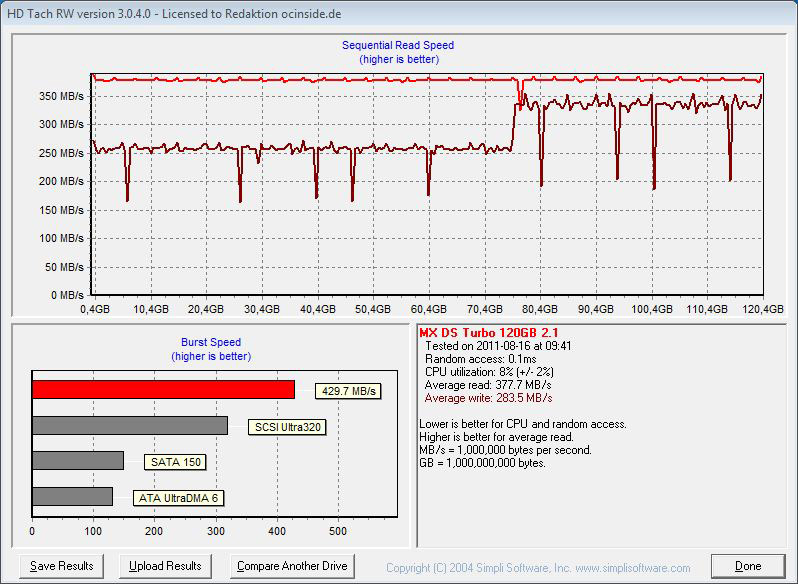
To compare these results you can move the mouse over the following drives to see their respective benchmark results:
Intel 600p 512GB M.2 NVMe SSD an SATA3 AHCI, ADATA S511 120GB SSD, ADATA S511 120GB SSD, Crucial BX200 960GB 2.5″ SSD, Crucial BX200 480GB 2.5″ SSD, Crucial BX100 1TB 2.5″ SSD, Crucial BX100 500GB 2.5″ SSD, Crucial MX100 512GB 2.5″ SSD, Crucial MX200 1TB 2.5″ SSD, Crucial MX200 500GB 2.5″ SSD, Crucial MX200 500GB M.2 SSD, Crucial MX200 500GB mSATA SSD, Crucial MX200 250GB 2.5″ SSD, 2x Crucial MX200 250GB 2.5″ SSDs RAID0, 3x Crucial MX200 250GB 2.5″ SSDs RAID0, 4x Crucial MX200 250GB 2.5″ SSDs RAID0, Crucial MX300 750GB 2.5″ SSD, Crucial MX300 525GB M.2 SSD an SATA3 AHCI, Crucial MX300 2050GB 2.5″ SSD, Crucial M500 480GB 2.5″ SSD, Crucial M550 512GB 2.5″ SSD, Crucial M550 512GB M.2 SSD, Crucial M550 512GB mSATA SSD, 2x Crucial m4 128GB 2.5″ SSD an SATA3 RAID, Crucial m4 128GB 2.5″ SSD, Crucial m4 128GB 2.5″ SSD an SATA3, Crucial m4 256GB 2.5″ SSD FW 000F, Crucial m4 256GB 2.5″ SSD FW 0309, Crucial m4 256GB 2.5″ SSD FW 0002, Crucial m4 256GB SSD FW 0309 an SATA3 IDE, Crucial m4 256GB 2.5″ SSD FW 0002 an SATA3, Crucial C300 64GB 1.8″ SSD an SATA3, Crucial RealSSD C300 256GB 2.5″ SSD an SATA3, Crucial RealSSD C300 256GB 2.5″ SSD an SATA2, Hitachi 7K1000.C 1TB HDD, Intel SSD 750 1200GB PCIe Karte Gen3 x4, MX-DS Fusion 60GB SSD SATA3 IDE, MX-DS Fusion 60GB SSD SATA3 IDE, MX-DS Turbo 120GB SSD, OCZ Agility 128GB SSD, OCZ Vector 180 480GB 2.5″ SSD, Plextor M8SeGN 512GB M.2 NVMe SSD, Plextor M6e 256GB M.2 SSD PCIe AHCI, 2x Plextor M5 Pro Xtreme 256GB 2.5″ SSD an SATA3 RAID0, Plextor M5 Pro Xtreme 256GB 2.5″ SSD, Plextor M5M 128GB mSATA SSD, Samsung 960 Evo 500GB M.2 PCIe NVMe Gen3 x4 SSD, Samsung 960 Pro 1TB M.2 PCIe NVMe Gen3 x4 SSD, Samsung Series470 128GB SSD AHCI, Samsung 470 128GB SSD Legacy IDE, Samsung 850 Pro 128GB 2.5″ SSD, Samsung T5 Portable 500GB USB 3.1 SSD, Seagate Constellation.2 1TB 2.5″ HDD an SATA3, Seagate ST2000DX001 2TB 3.5″ SSHD, Toshiba MK8007GAH 1.8″ HDD.
Here is a screenshot of the HD Tach benchmark values:
Here is a comparison of the HD Tach benchmark values that are gradually being expanded with new drives:
And here is an excerpt of the latest HD tach benchmark values that will be gradually replaced with latest drives for clarity:
SiSoftware Sandra benchmark result …
SiSoftware Sandra benchmark should not be missing in this test series. SiSoftware offers with their SiSoft Sandra program a very comprehensive tool, which contains a lot of tools to get very reliable test results of all hardware components.
The average access time of the Intel 600p 512 GB M.2 NVMe SSD is very low in SiSoftware Sandra with 48us and the drive index of 1.29 GB/s is quite high.
Here is a screenshot of the SiSoftware Sandra benchmark read values:

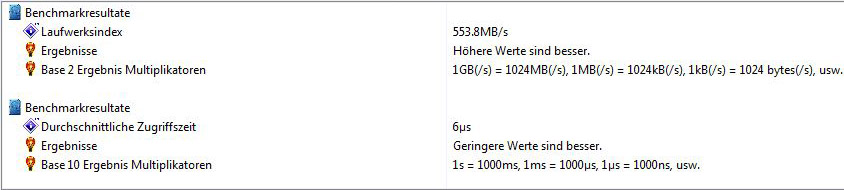
In the write performance measurement, the average access time of the Intel 600p 512 GB M.2 NVMe SSD in SiSoftware Sandra is also at extremely low 6us, but the drive index reached “only” 553.8 MB/s.
Here is a screenshot of the SiSoftware Sandra benchmark write values:
Here is a comparison of the SiSoftware Sandra benchmark values, which are getting updated with soon coming drives:
And here is an excerpt of the latest SiSoftware Sandra benchmark values that will be gradually replaced with latest drives for clarity:
Intel 600p 512GB NVMe Result and general impression …