

Overclocking, power consumption, temperature and benchmark …
Let’s start with benchmarks …
Benchmark …
To get a good impression of the performance of the Xeon, we have included several benchmarks in our course (Benchmark Download). We have listed them here:
| Benchmark Tools |
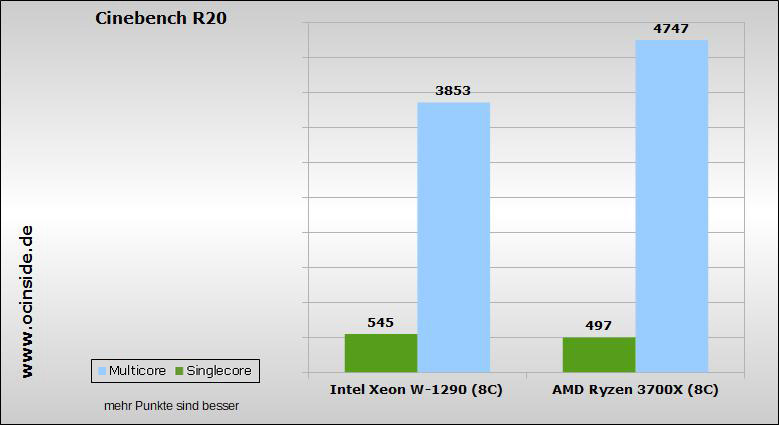
| Cinebench R20 (Version R20.060) |
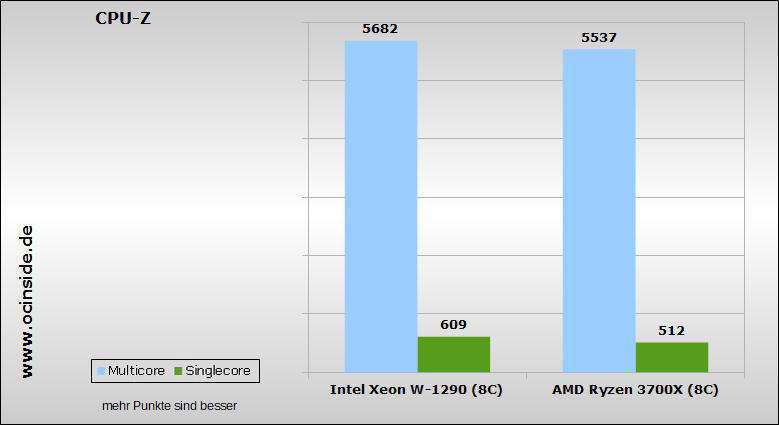
| CPU-Z (Version 1.93.0 x64) |
| PCMark (Version 2.1.2177 64) |
| 3DMark (Version 2.12.6964 64) |
| Unigine Superposition (Version 1.1 build 8628) |
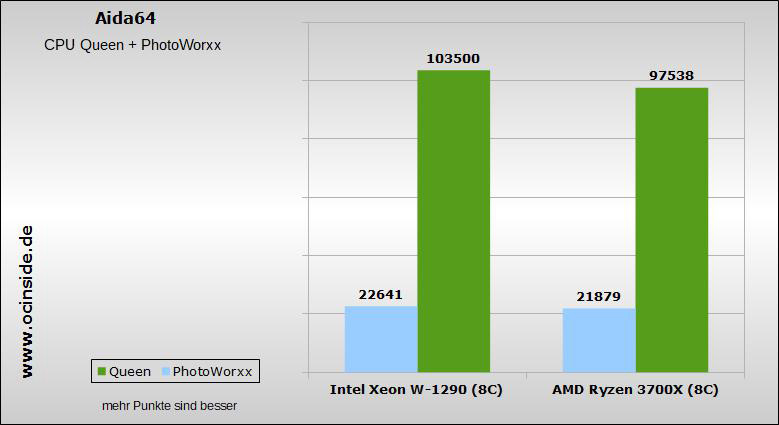
| AIDA64 Engineer (Version 6.25.5400) |
Each benchmark was run through 3 times and an average value was determined. In addition, we have included an AMD Ryzen 7 3700X in the course, against which the Xeon with 8 cores is allowed to compete. Concerning the memory configuration, we followed the two manufacturer recommendations. The Xeon was operated with DDR4-3000 (Intel specifies DDR4-2933 here). The Ryzen from AMD, however, was allowed to run with the recommended DDR4-3200MHz. We chose this setting deliberately so that the Xeon would not be favored by overclocking its memory, and the Ryzen would not be disadvantaged by underclocking. By the way, both processors ran with the factory default boot settings without overclocking or TDP adjustment.
In the second run, we activated all 10 cores of the Xeon and let them compete against an OC setting, but more about that later.
Now let’s start our evaluation with the duel Intel Xeon W-1290 reduced to 8 cores against AMD Ryzen 3700X (8 cores) to get a better comparison of performance under similar conditions.
Intel Xeon W-1290 (reduced to 8 cores) vs AMD Ryzen 7 3700X …
The first round gives an ambiguous result, the Xeon can clearly beat the Ryzen in the cinebench when passing through with only one core. This is not surprising, since there is almost a difference of one gigahertz. The Xeon finally clocks up to 5.1GHz, which we could observe during the run. The Ryzen, on the other hand, came here perhaps to 4.3GHz on one core. But if you look at the value for the run through with all cores including SMT/HT, the Xeon clearly loses against AMD.
CPU-Z shows a completely different picture, the Xeon can clearly perform better than the Ryzen.
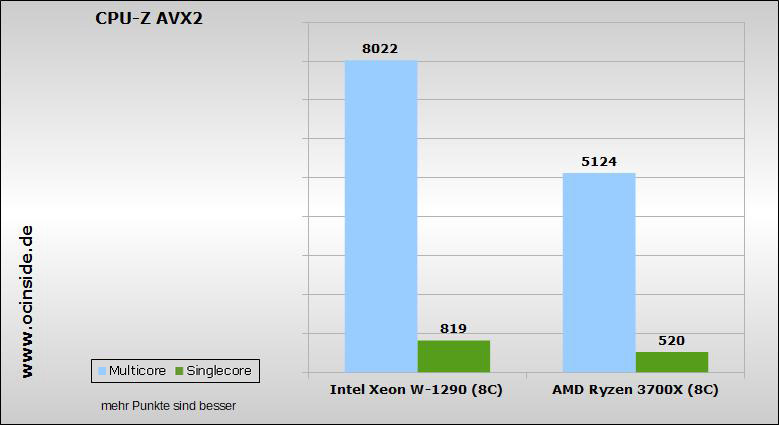
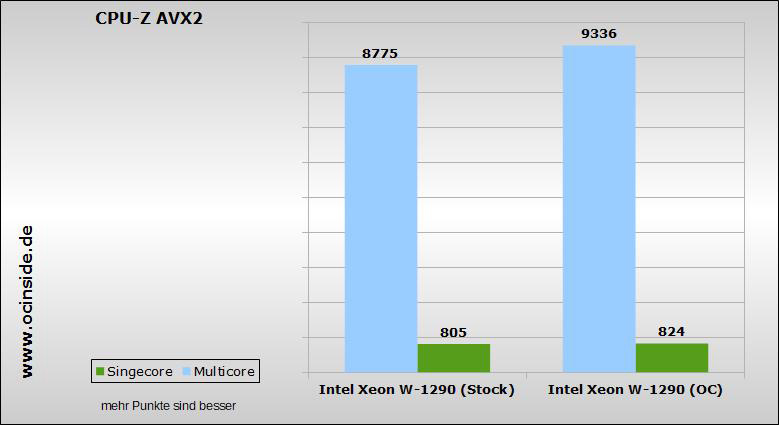
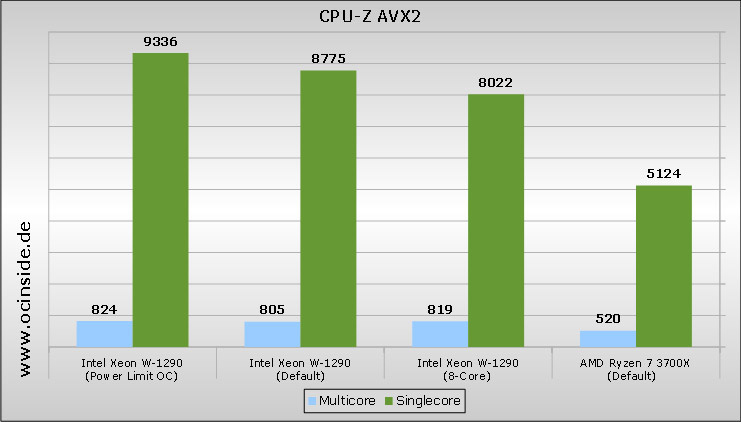
It becomes even clearer when we start the AVX2 benchmark in CPU-Z. Intel seems to have done a lot better here with the Xeon compared to AMD. After all, the Xeon delivers almost 37% more points in the multicore benchmark.
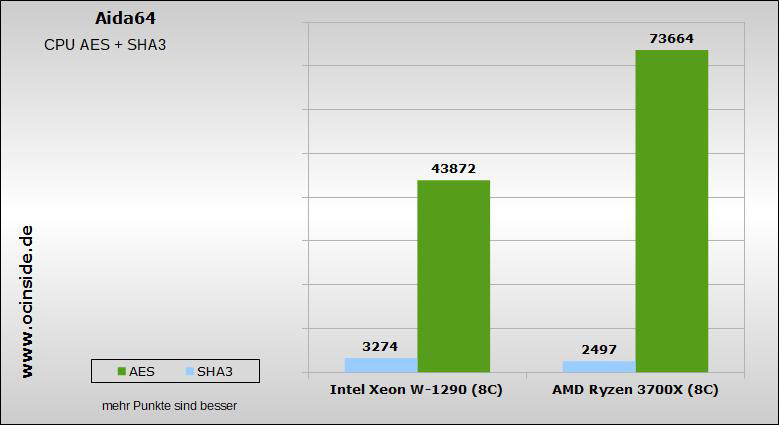
Let’s take a look at AIDA64 next. Here, the two processors lie almost equally, with a slight lead for the Xeon W-1290.
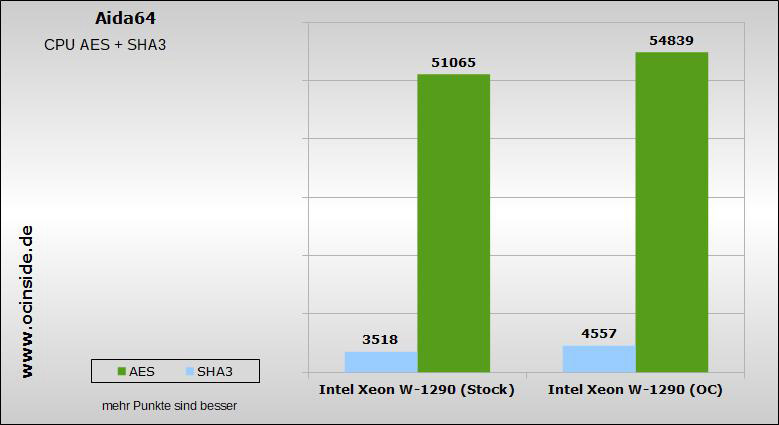
There is also no clear winner when it comes to CPU encryption instructions, Ryzen can calculate AES encryption much better than Xeon. But the Xeon performs much better with SHA3.
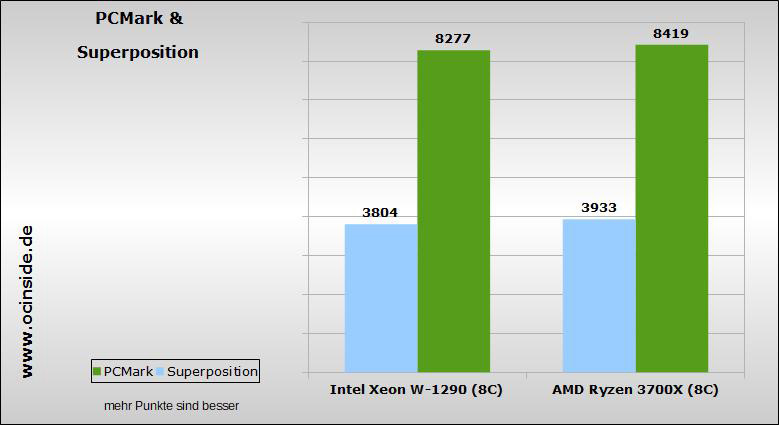
Before we now come to the benchmarks for games, let’s have a last look at PC-Mark and the graphics limited superposition. Here the Xeon is just behind the AMD.
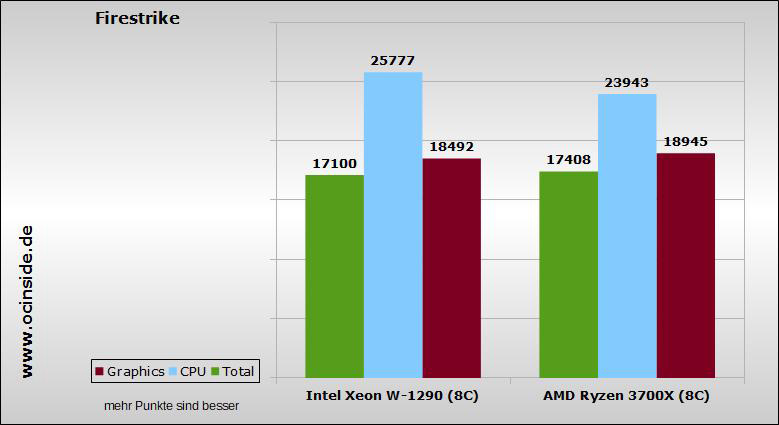
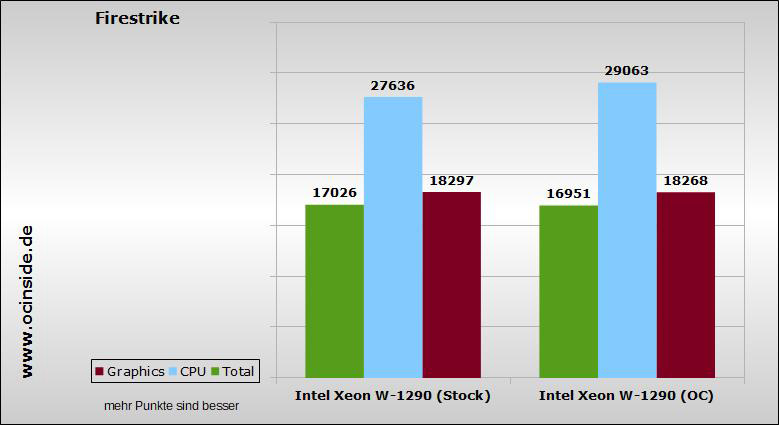
Now we come to the popular Firestrike from 3D Mark, at second glance you can see that the Intel in games performs a bit better than AMDs 3700X. Strangely enough, our Nvidia 1070ti with the AMD system delivers more points than on the Intel system despite identical drivers. The most important value for us is the CPU score. Here the Xeon can place itself with almost 2.5% before the AMD.
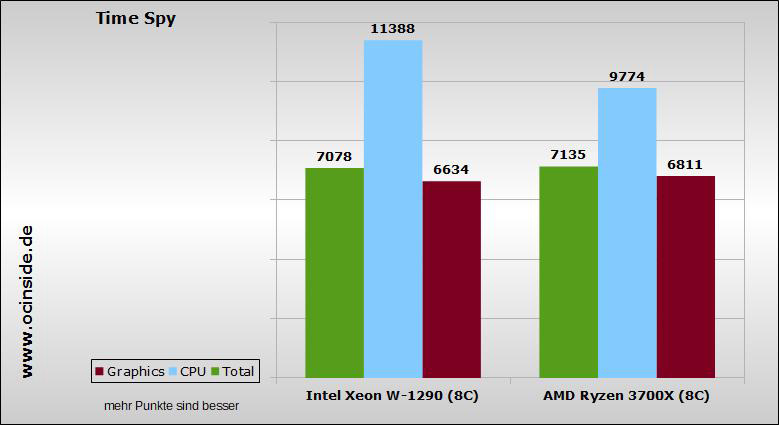
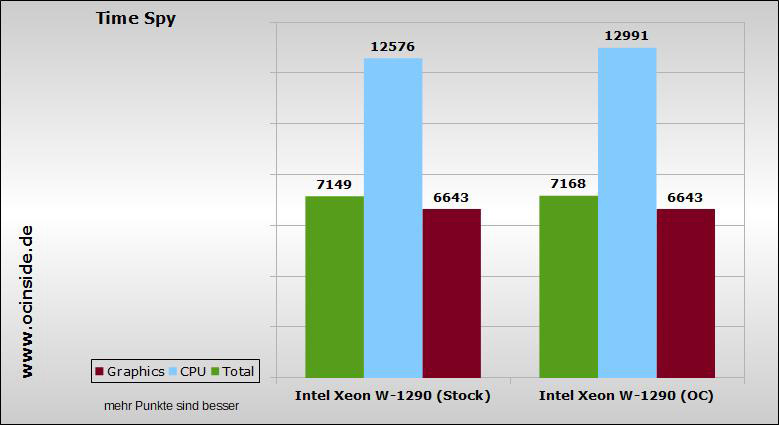
We see a similar picture with Time Spy. Here the Xeon with 14% even performs noticeably more than the AMD.
Why the Nvidia 1070 Ti delivers a few more points under AMD’s processor, however, we could not find out. In any case, the behavior could be reproduced several times.
Regardless of this, the Xeon W-1290 performed quite well and is even better than AMD’s Ryzen in many areas. But if you take a closer look at the clock performance during the tests, you will notice that Intel applied the handbrake on the Xeon to make it work within its 80 watt TDP. This is because the processor only reaches 5.1 GHz for a maximum of 10 seconds, after which the power limit is reached and a clock of 3.2 GHz to 3.6 GHz is applied, depending on the load.
Exactly this clock behavior also explains why the Xeon, as expected, overtakes the Ryzen in the “Single Core” test at Cinebench, but cannot catch up with it in the “Multi Core” test. Short benchmarks, such as those in AIDA64 or CPU-Z, deliver such high values because the Xeon is not yet throttled. So if the load lasts longer than 10 seconds, the Xeon will quickly become a fun-killer.
Intel Xeon W-1290 overclocking …
Before we now look at the values for the benchmarks with 10 cores, it’s time to release the handbrake from Intel and deal with the topic Intel Xeon overclocking.
Even if the W-1290 is not a K CPU and thus we are denied to raise the multiplier, the ASRock motherboard still offers us many possibilities to adjust the clock speed of the Intel processor. After all, the 5.1 GHz reached ex factory are not a bad starting point and just have to be kept longer or permanently. After a short look into the UEFI we already found the appropriate point.
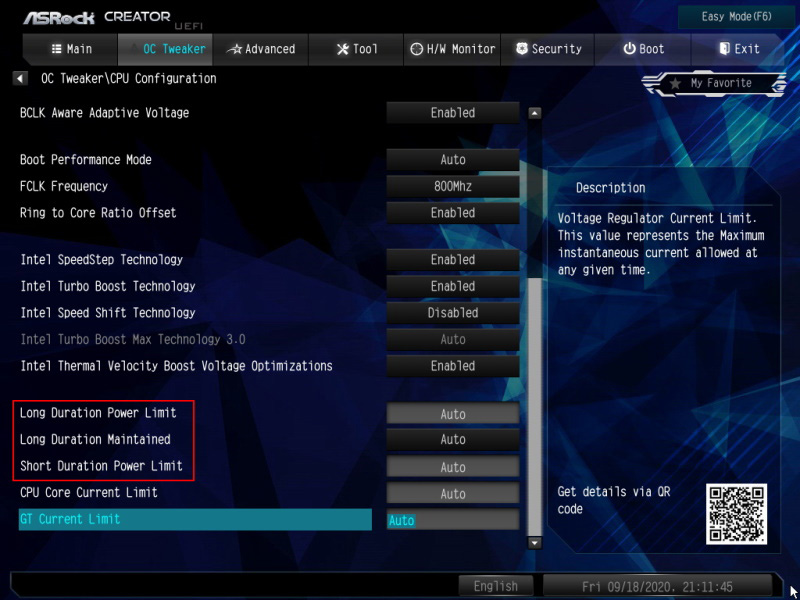
The important gears here are “Long Duration Power Limit”, “Long Duration Power Maintained” and “Short Duration Power Limit”. We have set the values for Short & Long Duration Power Limit to 250W. For “Long Duration Power Maintained” we could set a maximum of 128 seconds, i.e. after these 128 seconds of continuous load the clock is reduced again. Normally this should be sufficient to keep the clock rate permanently. An exception is of course applications that use the CPU completely for a longer period of time, such as video encoding.
Power Limit …
For those who have not yet dealt with the 3 UEFI points at Intel, here is a short explanation again:
Short Duration Power Limit defines how much energy the processor may use for a short period of time. (Here it is 10 seconds)
Long Duration Power Limit is basically nothing else, only that here the energy consumption for full load operation is defined, which is normally lower.
Long Duration Power Maintained defines for how many seconds the “Long Duration Power Limit” applies.
After the values were stored in the UEFI, we wanted to test with Prime95 if the clock could be kept.
Temperature …
So we soon encountered a new problem, the temperatures. The cooler we used was by far not sufficient to cool the processor. In comparison to the standard settings of Intel, we reached a good 50°C with our Scythe air cooler, after the CPU was massively reduced.
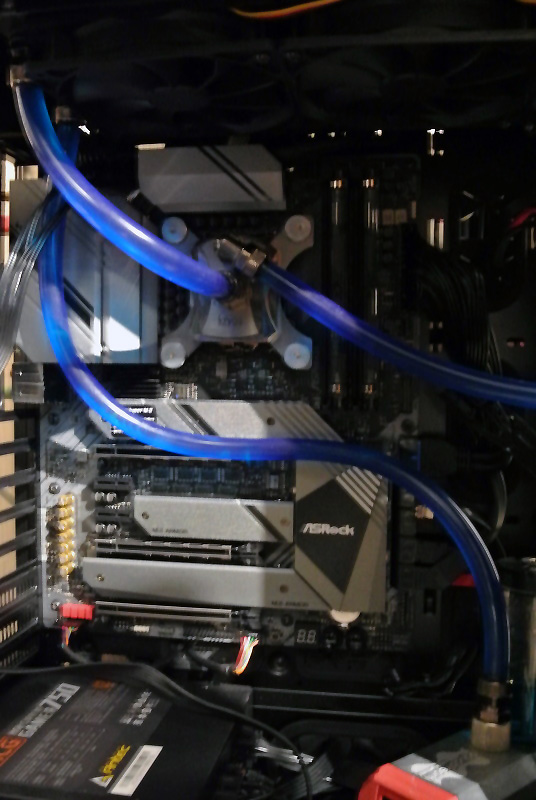
A measurement without limitation was no longer possible with the air cooler. After about 30 seconds, the CPU was throttled down because it reached the temperature limit. So we decided to put the Xeon under water. We used our Custom Loop, which consists of a 240 and a 360 radiator. Afterwards we could keep the boost clock with 4.7GHz under prime (smallest FFTs) at 86°C.
We have summarized the results here in a small table:
| Vcore | Clock | Temperature | Cooling | |
|---|---|---|---|---|
| Standard | 0.820 V | 2.66 GHz | 50°C | Air cooling |
| Overclocked | 1.280 V | 4.70 GHz | 85.25°C | Water cooling |
Power consumption …
Of course, we also looked at the power consumption of the Xeon. To measure this as accurately as possible, we removed the graphics card from the system. We measured the complete system including water cooling.
In idle we could measure 51 watts, under full load the power consumption was 306 watts. It should be noted here that we were able to measure the 306 watts even when the power limits were not deactivated by us. After 10 seconds, the Xeon consumed only 118 watts.
So much for overclocking and temperatures.
Intel Xeon W-1290 with powerlimit vs without powerlimit …
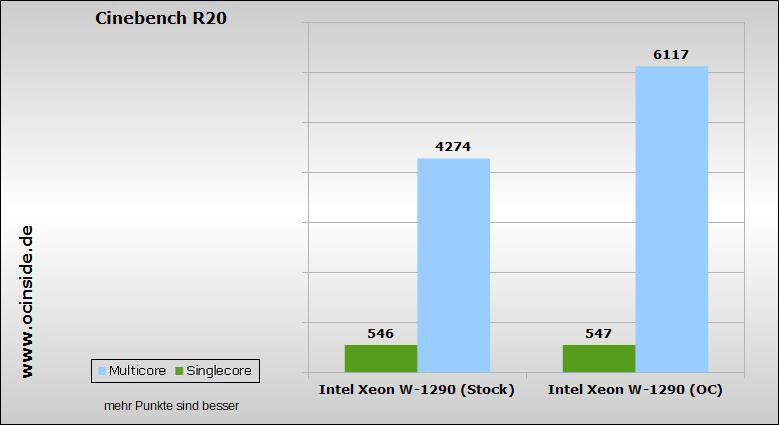
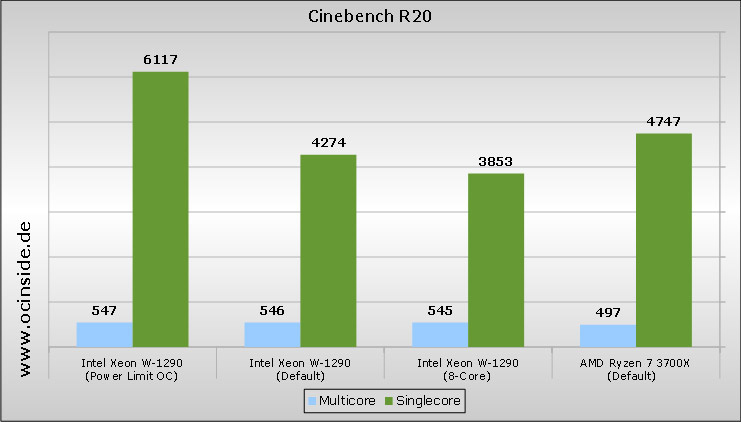
Now let’s see how the Xeon with 10 cores can stand up to itself without power limit. The start will be made by Cinebench again. Here you can clearly see how much power is wasted by the limitation to 80 watts TDP. Here the power in the Multi Core Test is almost 30% higher than with activated limitation. The value in the Single Core Test is identical.
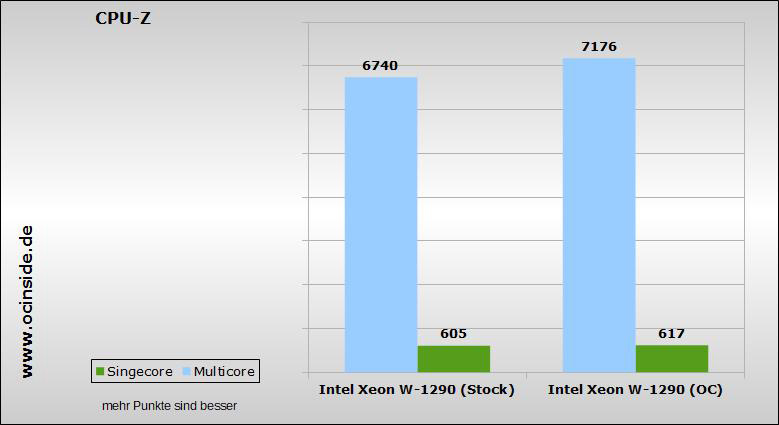
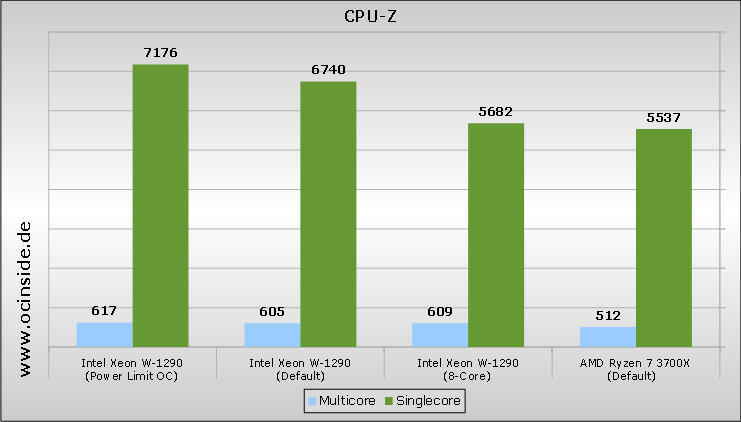
Even though the duration of the CPU-Z benchmark is not extremely long, we could also see a significant performance increase here.
The same is true for the AVX2 benchmark from CPU-Z. Here, the Xeon gains almost 6% under load on all cores.
If we take a look at the encryption benchmarks of AIDA64, there is also a small performance bonus.
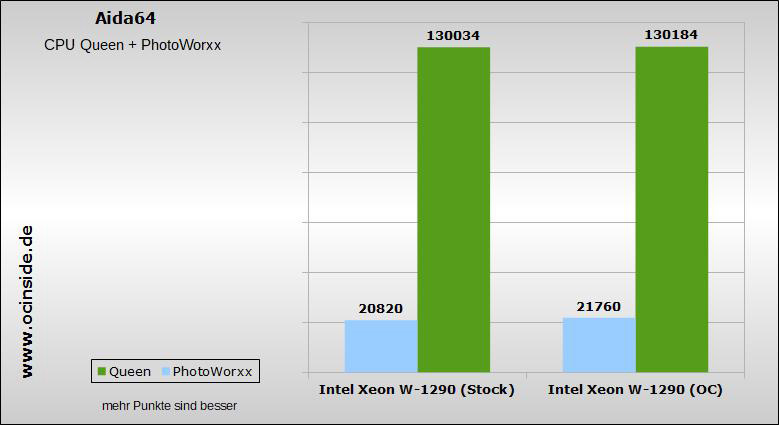
With CPU Queen and CPU PhotoWorxx, however, the added value is more or less within the tolerance range.
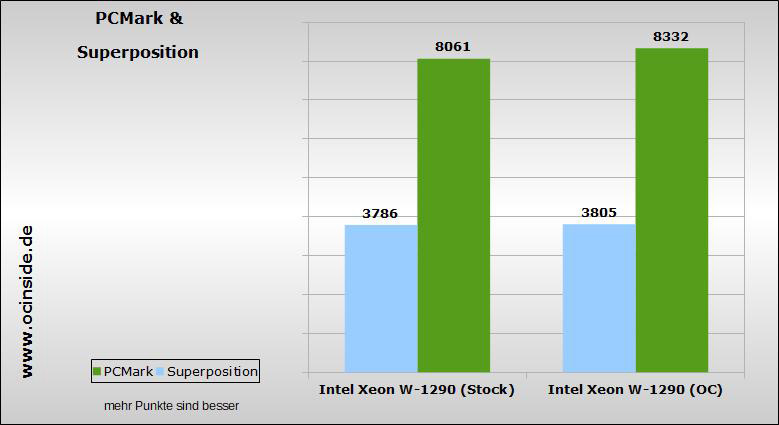
In graphics limited benchmarks such as Superposition, there is no noticeable difference as with 8 cores. But we were able to get a few more points out of PC Mark.
So let’s summarize the results of the Intel Xeon W-1290 CPU with Power Limit overclocking, with Standard Power Limit and with reduced cores in an exemplary comparison with an AMD Ryzen 7 3700X CPU.
Intel Xeon W-1290 Power Limit OC/10 core standard/8 core vs. AMD Ryzen 7 3700X …
First in the Cinebench R20 benchmark.
Afterwards with the CPU-Z benchmark.
CPU-Z shows a completely different picture, the Xeon can clearly perform better than the Ryzen.
And then again the AVX2 benchmark values in CPU-Z.
We continue with the gaming suitability of the Intel Xeon W1290 CPU.
Gaming …
Before we come to the end, let’s have a look at the game benchmarks from 3D Mark. The first one is Firestrike again, also here the performance went up a good 1300 points measurably.
We could also observe a better CPU score in TimeSpy. Probably it would even be a little bit higher if the graphics card would not limit it.
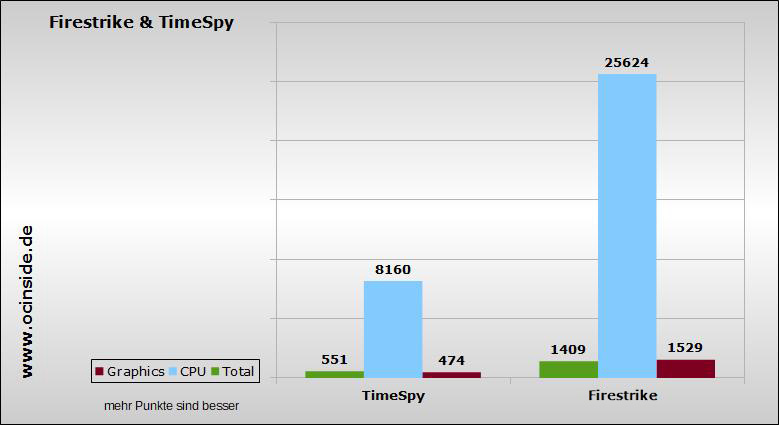
Finally, and for the sake of completeness, we tortured the Intel UHD P630 through Firestrike and TimeSpy. The result can be seen here. It should also be noted that we have set the processor settings back to default. An overclocking of the graphics card in the UEFI of the motherboard was not possible.
In summary it can be said that it is definitely worthwhile to overcome the limits of the processor in the UEFI, at least if you forget about the power consumption and the heat development for a short time or if you provide a suitable water cooling. Our recommendation would be a fair middle way, if the basic performance of the processor is not enough. In games like GTA V, Final Fantasy XV and Control, the Xeon made a good impression subjectively but also without overclocking. It also showed very good results when editing videos, pictures or virtualization.
Let us now finally come to the result and general impression …