
Benchmark values and test results …
Let us now turn to the benchmark results. The test results for SATA3 drives will be compared with an ASRock 890GX Extreme3 motherboard and the test results for mSATA and M.2 modules will be done with an ASRock Z97 Extreme6 motherboard. Microsoft Windows 7 Ultimate Edition is currently used as the operating system.
The SSD drive speed was examined and compared with the following benchmark software:
AS SSD Benchmark – Download
ATTO Disk Benchmark – Download
CrystalDiskMark – Download
HD Tach – Download
SiSoftware Sandra – Download
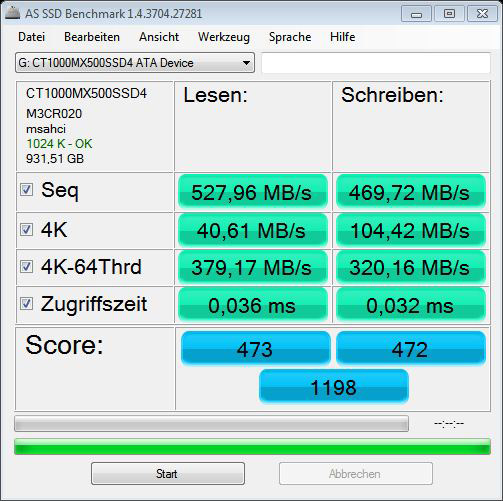
The AS SSD benchmark values provide a very good indication of the maximum possible read and write speed, the speed for smaller files and their respective access time. By the way, 4K means that small 4K blocks are read or written and with 4K 64Thrd this is distributed to 64 threads at the same time. For example, the benchmark program simulates a typical program start.
With the 1000GB Crucial drive a high sequential read and write speed could be achieved in the AHCI.
Tip:
Who now think about changing the SATA port in the BIOS from native / legacy IDE to AHCI, should first change for example only one part of the SATA port, where the drive with the operating system is not installed, if this is supported by the motherboard. Because if one like to save the new Windows installation, one must install the hard disk controller driver before changing SATA mode from IDE to AHCI – alternatively there are also Registry entries for it. If you like to upgrade from HDD to SSD, you should not copy the content 1:1 only with a tool like Norton Ghost or Acronis Backup. It is better to install a fresh Windows 7, Windows 8 or Windows 10 or adjust at least the SSD Alignment. We help you with questions to this topic or all other PC related questions at any time 24/7 in our German and English PC Forum.
The usable capacity of the Crucial MX500 is 931.51 GB. With the Crucial Storage Executive Tool you can adjust the over provisioning area as mentioned before and thus determine yourself how high you want to set the SSD durability vs. performance.
The Crucial MX500 1TB M.2 achieves at least 1198 points, which is almost equal to the 1147 points of the Crucial MX500 1TB 2.5″ SSD on the Intel test system and can therefore almost keep up with the 1206 points of the Samsung SSD 860 Evo and the 1203 points of the Samsung SSD 860 Pro.
Here is a screenshot of the AS SSD benchmark values (Crucial MX500 1TB M.2 AHCI Intel test system):
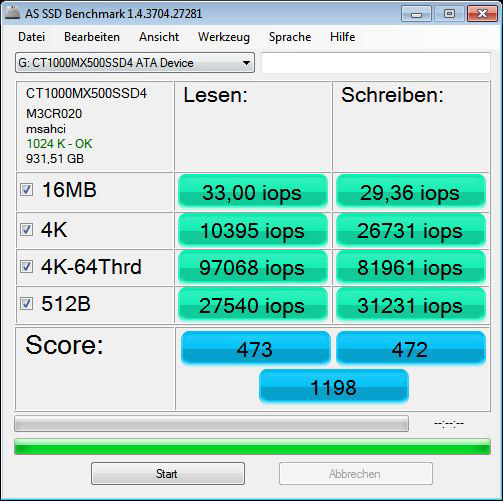
And here is another screenshot of the AS SSD iops results (Crucial MX500 1TB M.2 AHCI Intel test system):
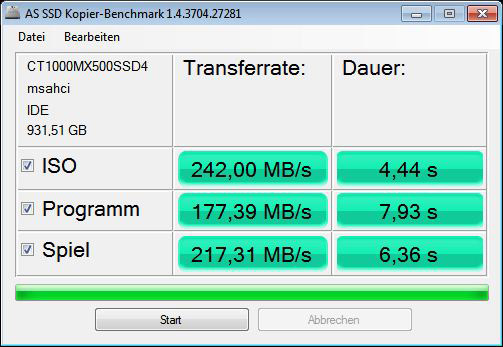
Here is a screenshot of the AS SSD copy benchmark results (Crucial MX500 1TB M.2 AHCI AMD test setup):
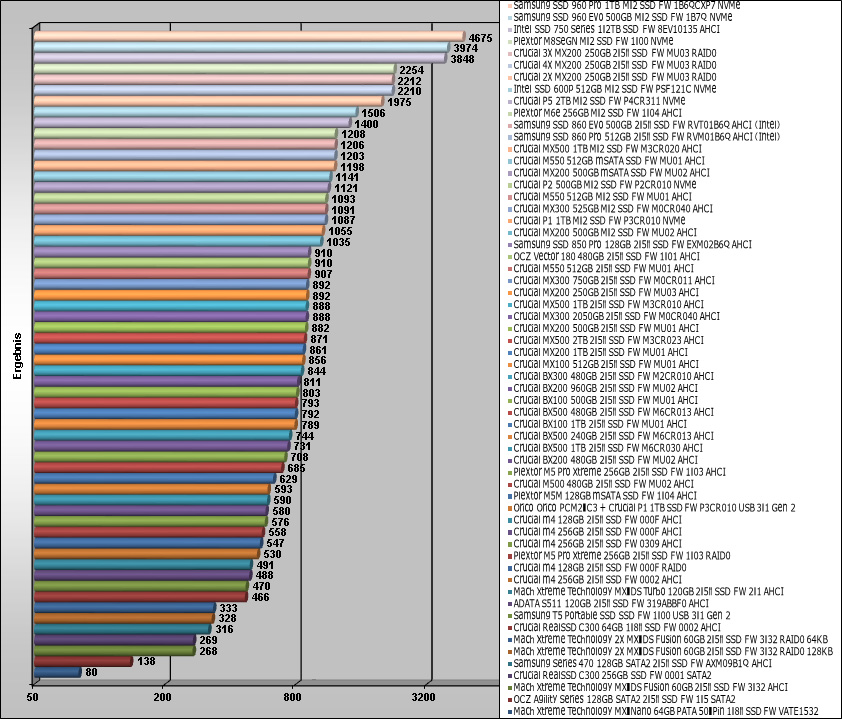
The comparison of the AS SSD benchmark results is extended with every new HDD/SSD test. One already sees some SSDs in comparison to the Crucial MX500 1TB M.2 SSD, whereby the graphics are regularly updated with new SSD drives. At the time of testing, the top of the AS SSD overall score is led by the Samsung 960 Pro 1TB M.2 NMVe SSD, followed by some more SSDs and directly behind the Samsung SSD 860 Pro SSD then the new MX500 M.2 SSD with 1TB capacity follows.
Here is a comparison of the AS SSD benchmark values, which are getting updated with new drives:
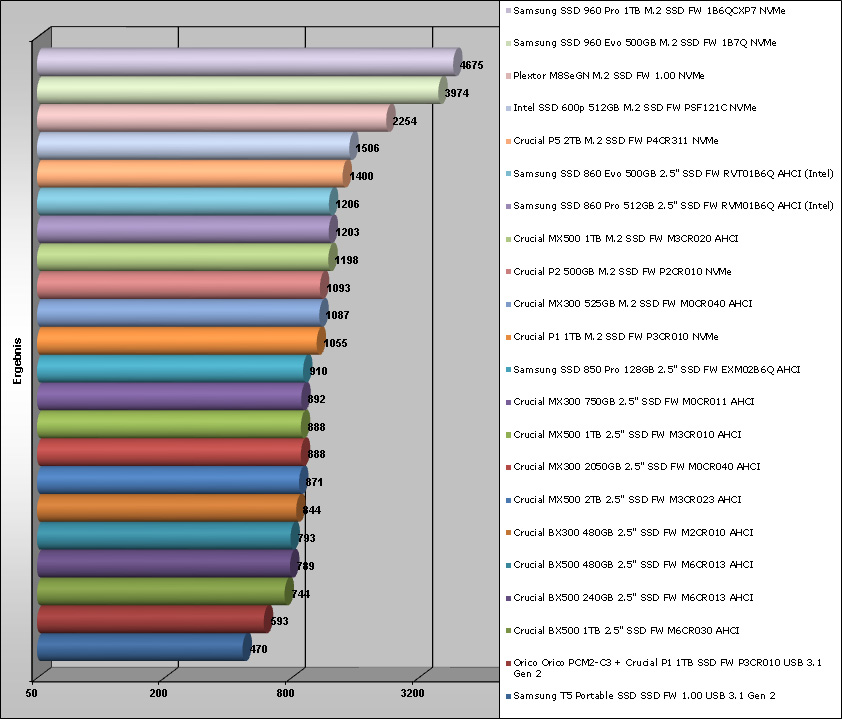
And here is an excerpt of the latest AS SSD benchmark results. For better overview, they will be gradually replaced with latest drives:
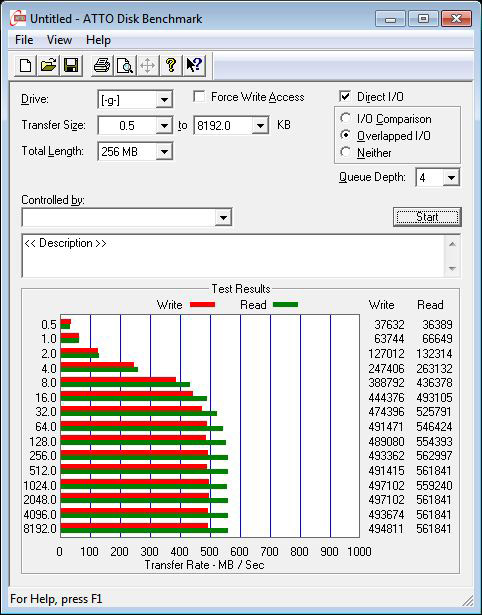
The ATTO disk benchmark results gives a very good overview about the write and read rate on different file sizes. These values are maximum ratings, which are different to the previously continuous transfer rate benchmarks, as this benchmark can be higher even with SSDs with a slower overall performance.
With the Crucial MX500 1TB M.2 SSD, the reading speed (green) is already above the writing speed (red) from a transfer size of approx. 1.0KB and reaches the maximum reading values of 562997KB with a transfer size of 256KB.
Here is a screenshot of the ATTO Disk benchmark values (M.2 SATA3 AHCI):
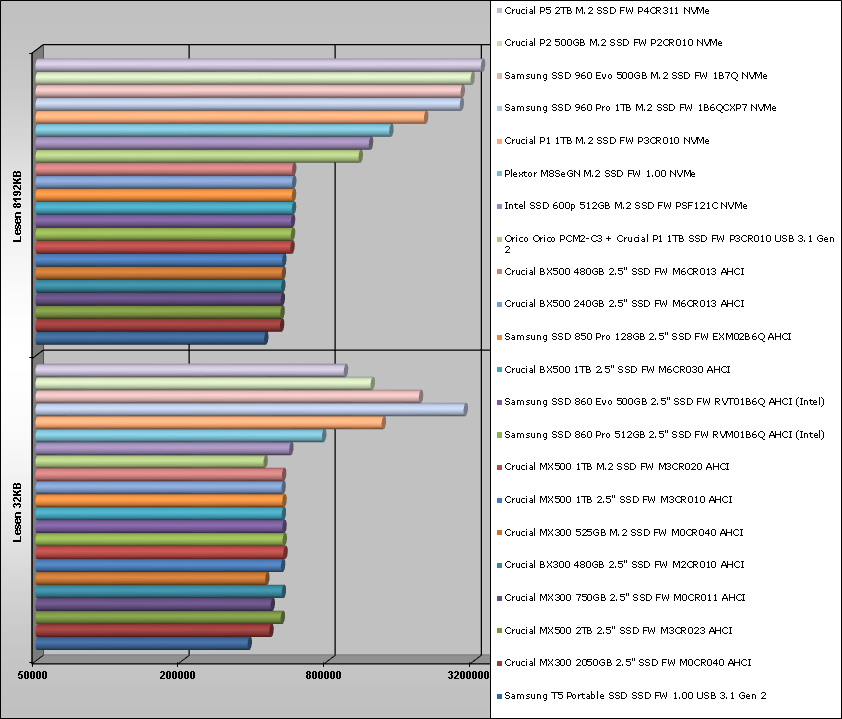
These ATTO disk benchmark values are now compared with a small transfer of 32KB and a large transfer of 8192KB. The bar chart already contains a comparison to some SSDs and hard disks, where the Crucial MX500 1TB M.2 SSD with ATTO still ranks clearly before the Crucial MX500 1TB 2.5″ SSD.
Here is a comparison of the ATTO disk benchmark values, which are getting updated with soon coming drives:
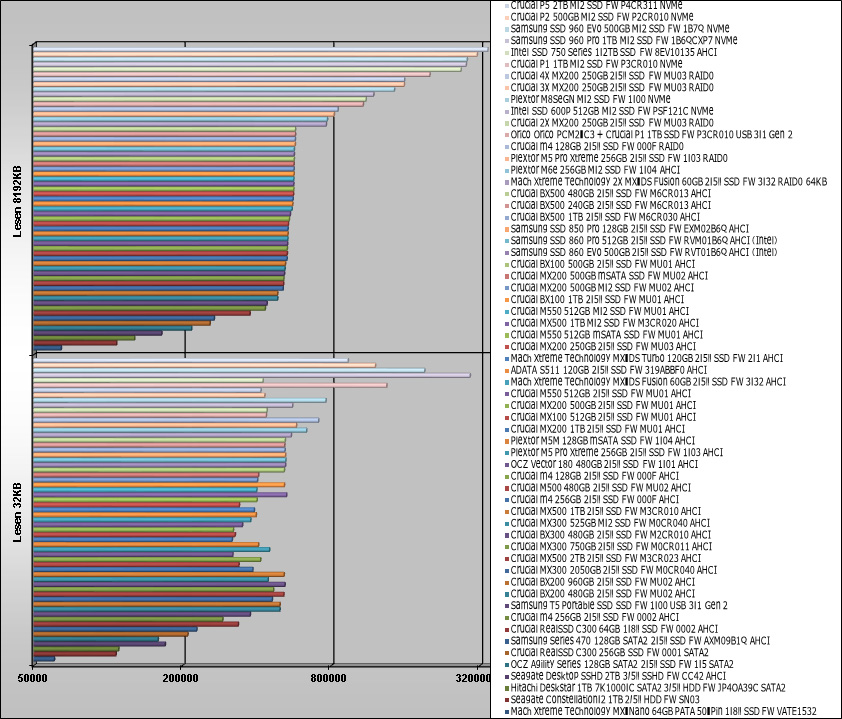
And here is an excerpt of the latest ATTO disk benchmark values for a better overview will be gradually replaced with latest drives:
CrystalDiskMark also provides a balanced measurement of performance with different transfer sizes.
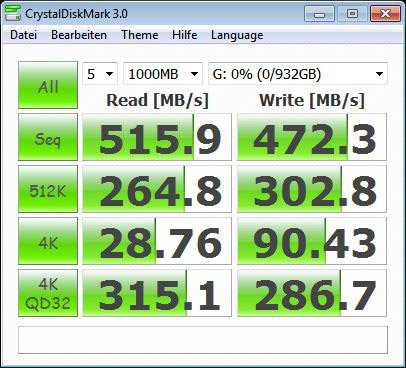
As before, the MX500 1000GB achieves very good sequential read values of 515.9 MB/s and write values of 472.3 MB/s in addition to the 4K-64Threads values.
Here is a screenshot of the CrystalDiskMark values (M.2 SATA3 AHCI):
The following diagram shows the CrystalDiskMark results again in comparison to the other SSDs and hard drives, which will be expanded step by step. In the CrystalDiskMark comparison one can see significant differences between the to-date tested of the Solid State Drives and Hard Disk Drives.
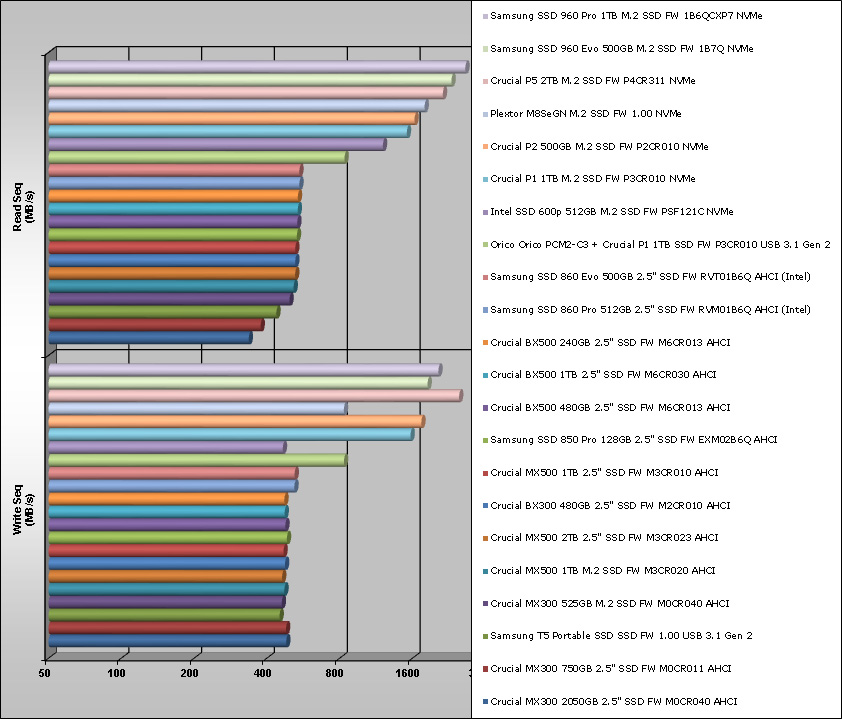
Here is a comparison of the CrystalDiskMark values, which are getting updated with soon coming drives:
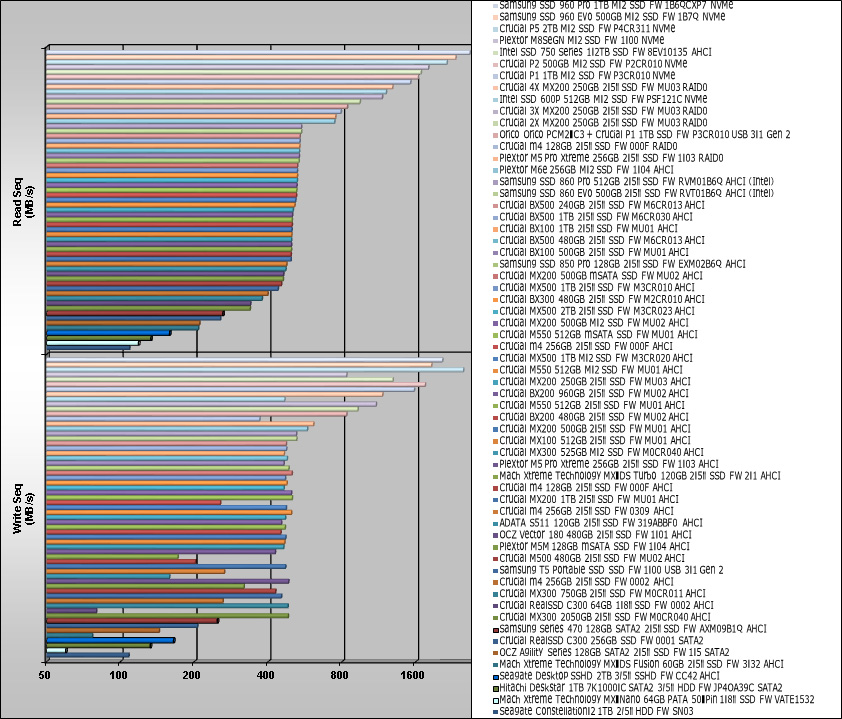
And here is an excerpt of the latest CrystalDiskMark values, which is gradually replaced with the latest drives:
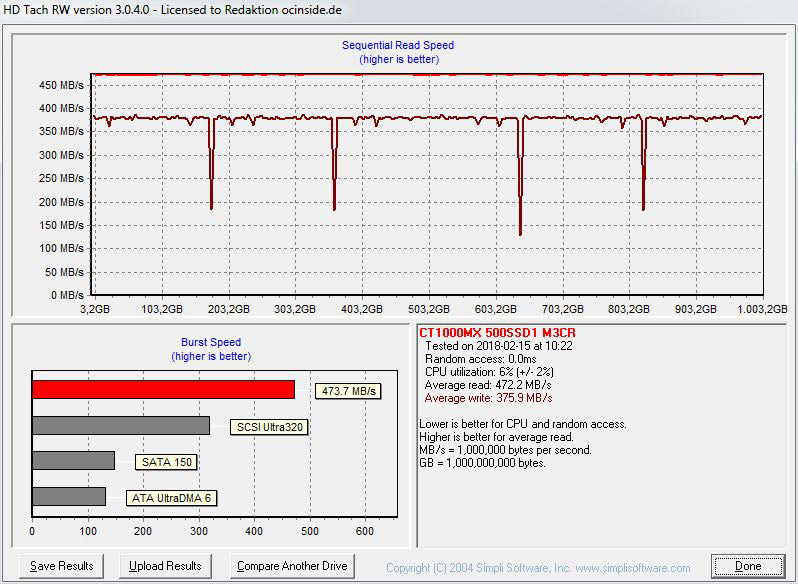
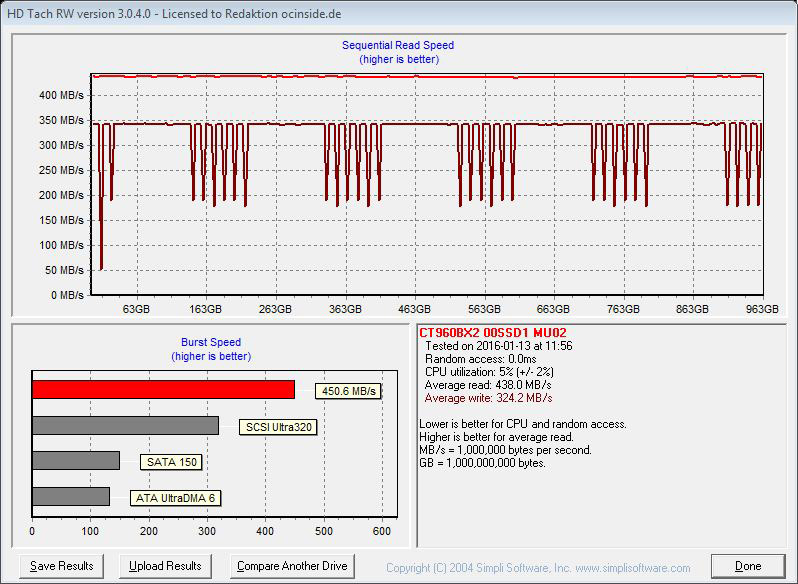
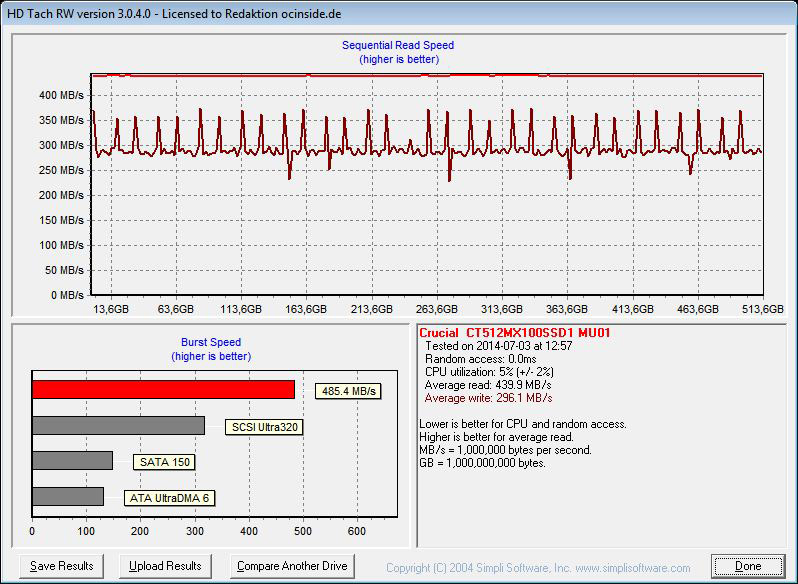
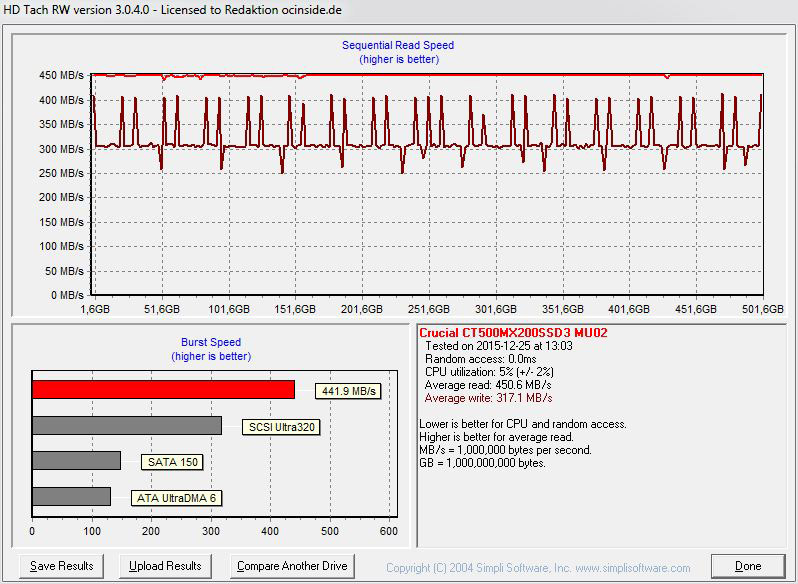
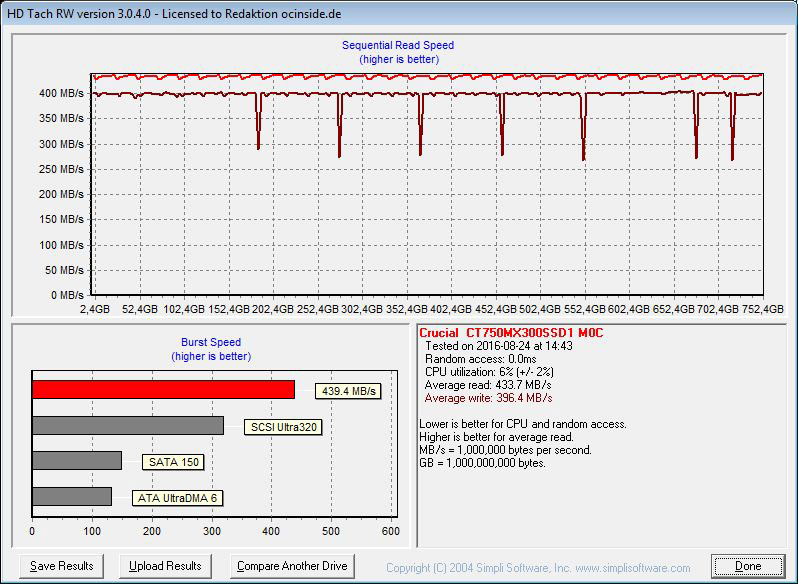
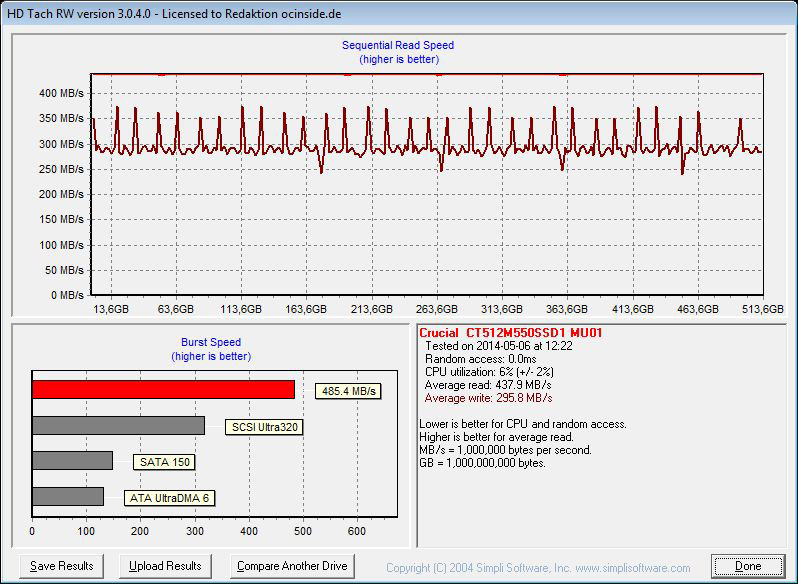
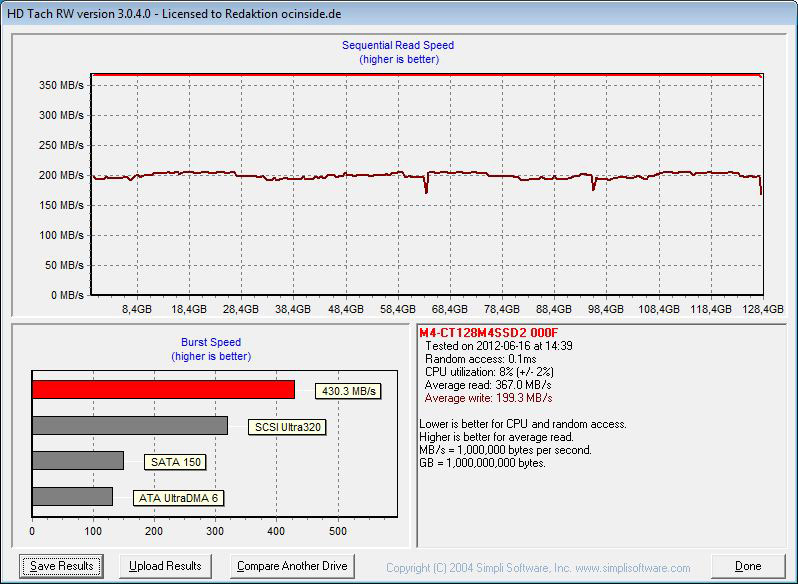
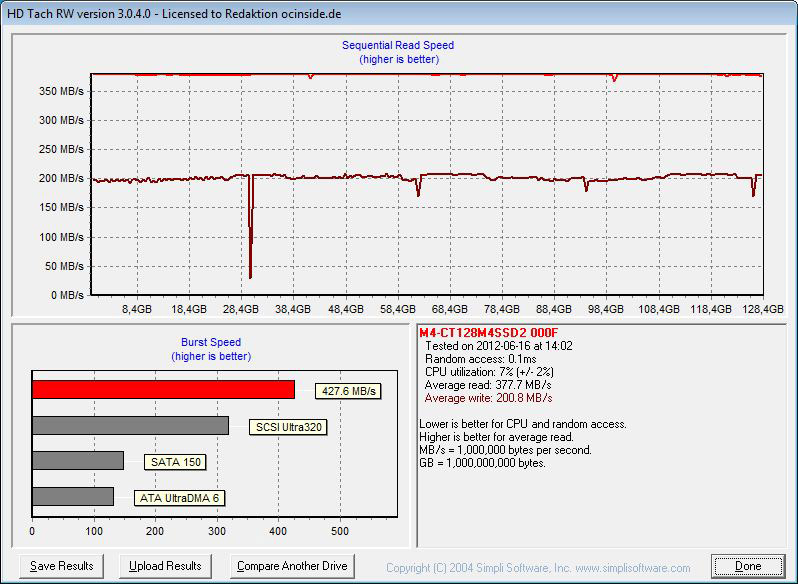
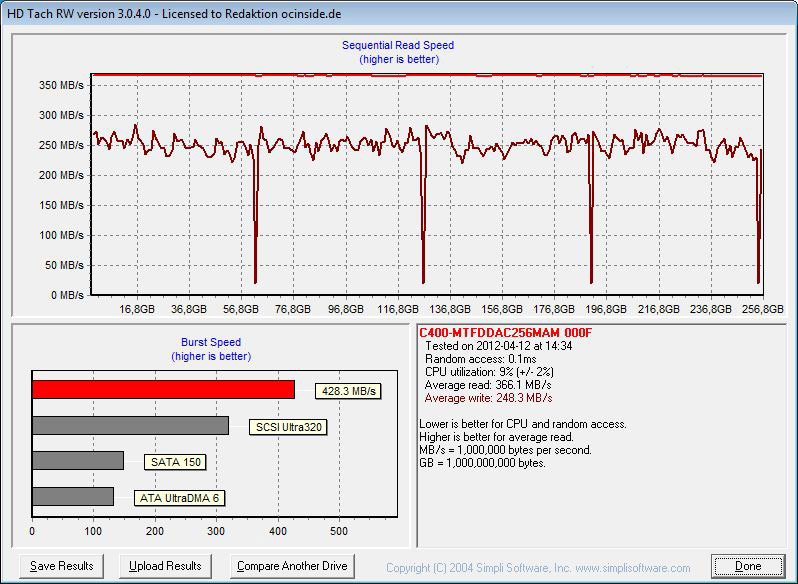
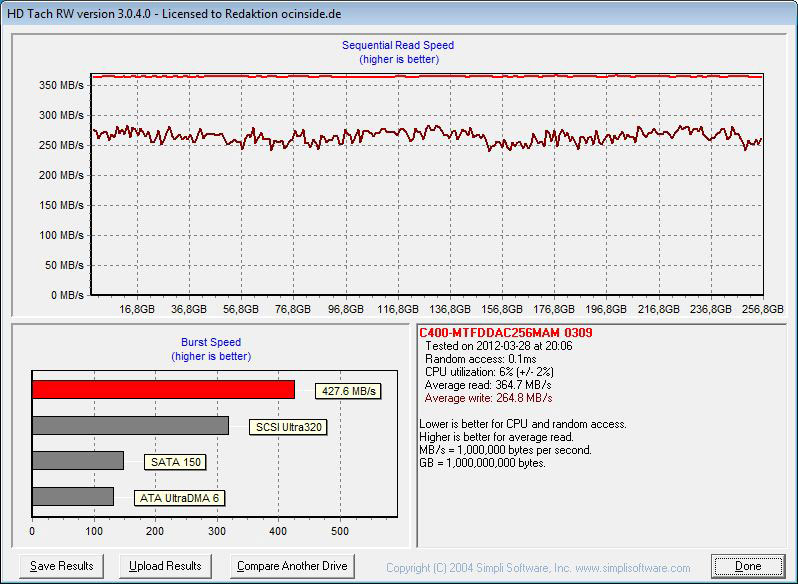
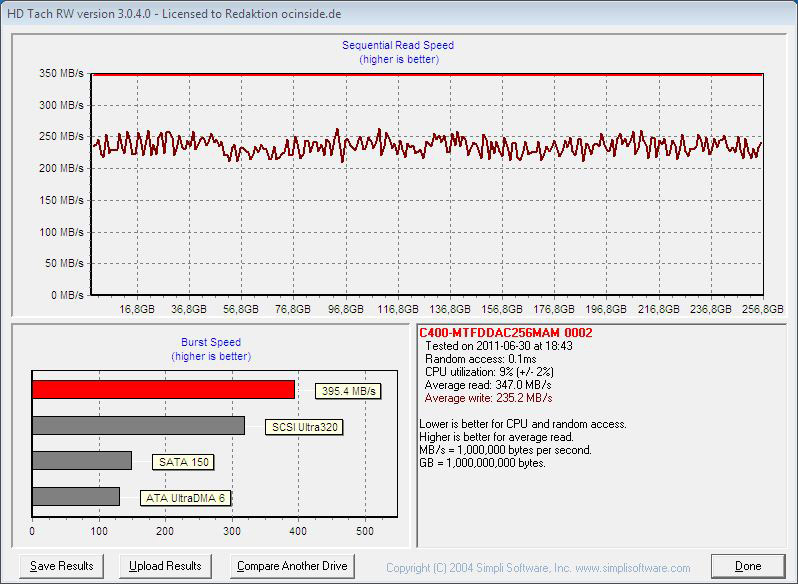
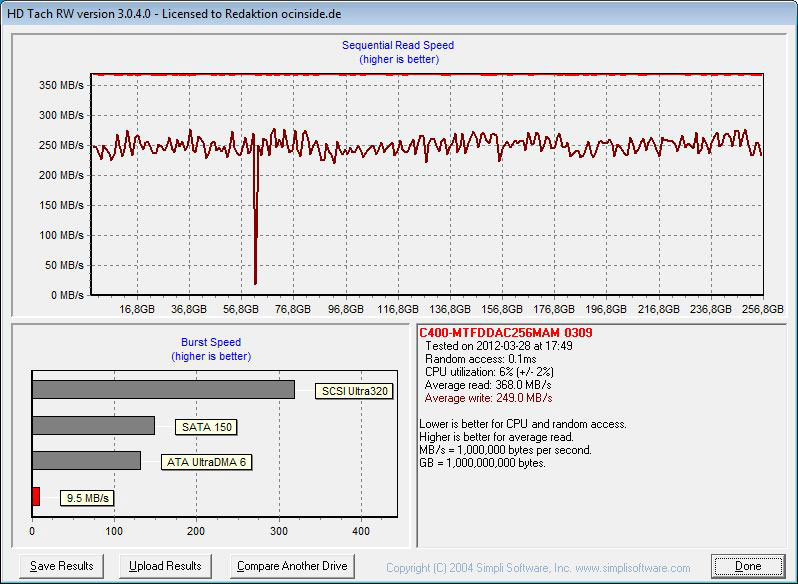
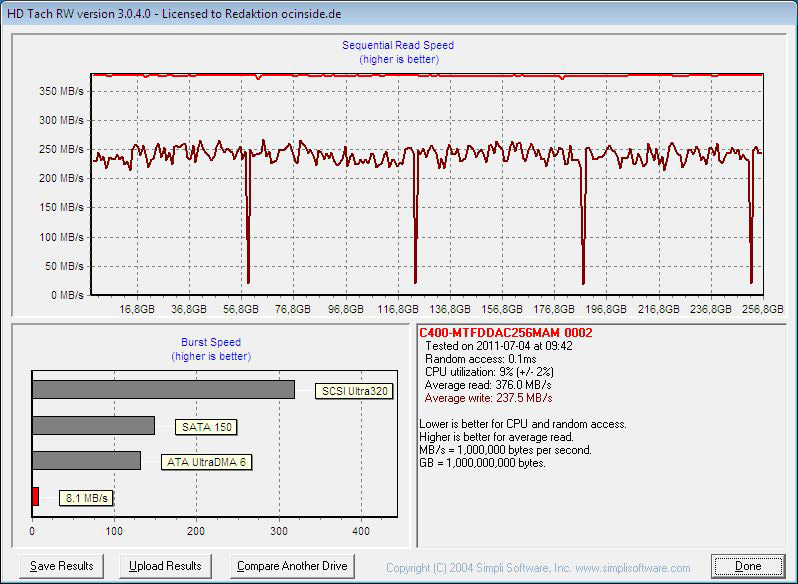
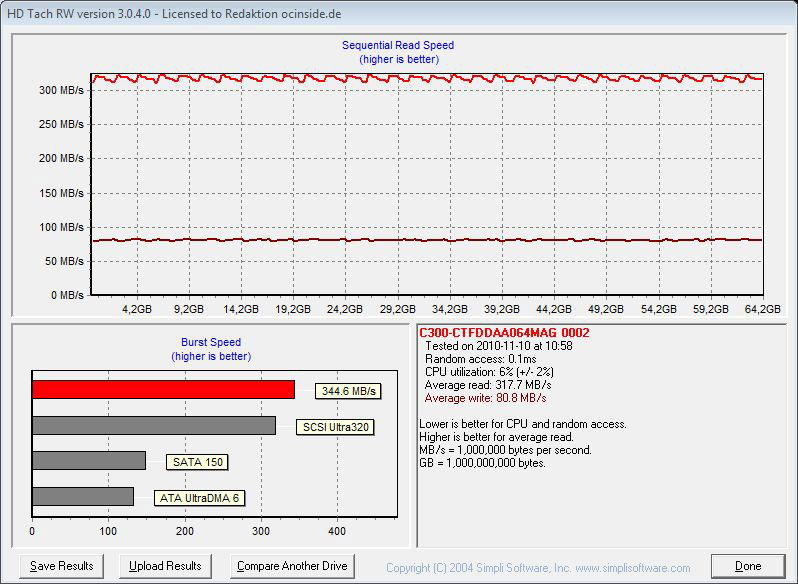
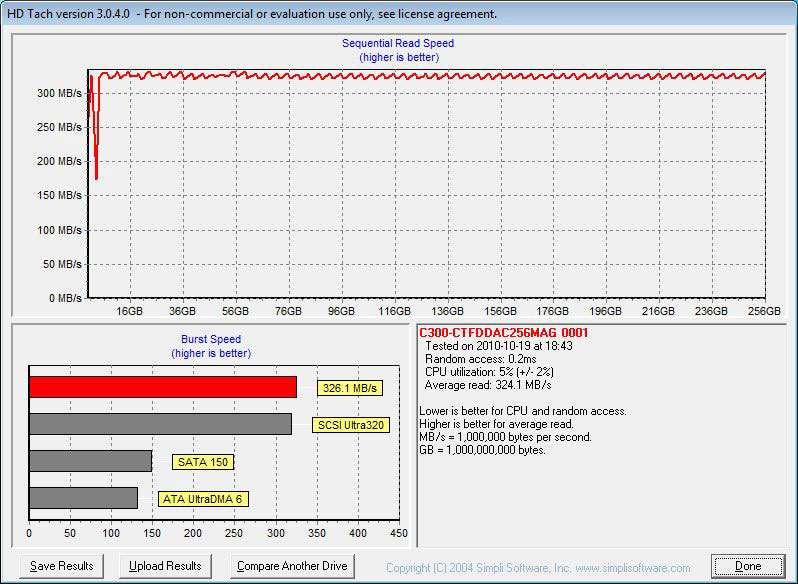
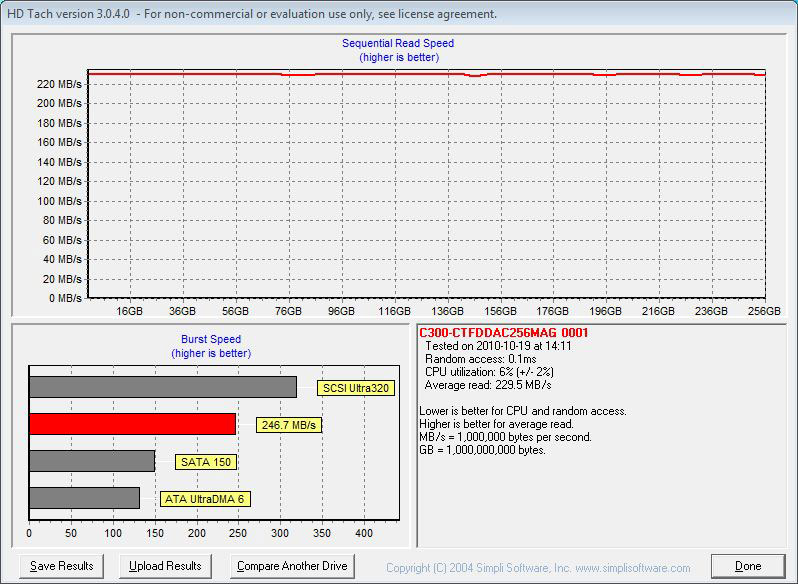
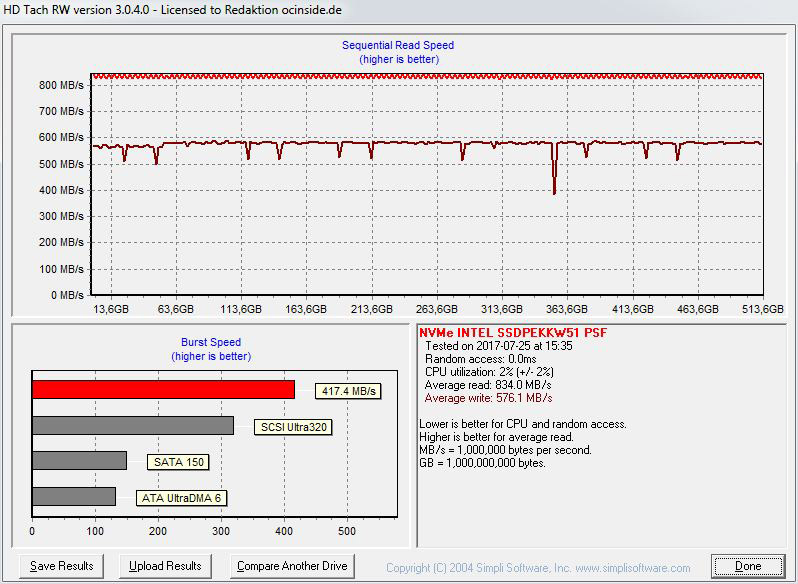
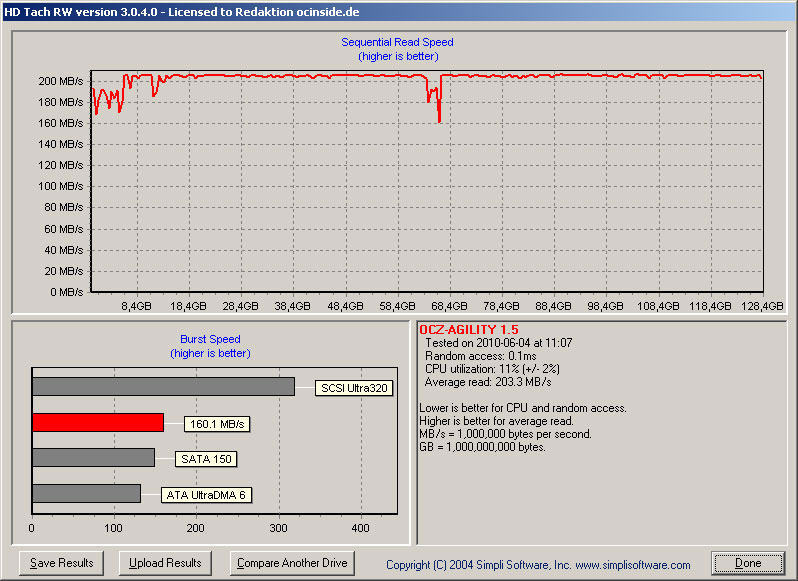
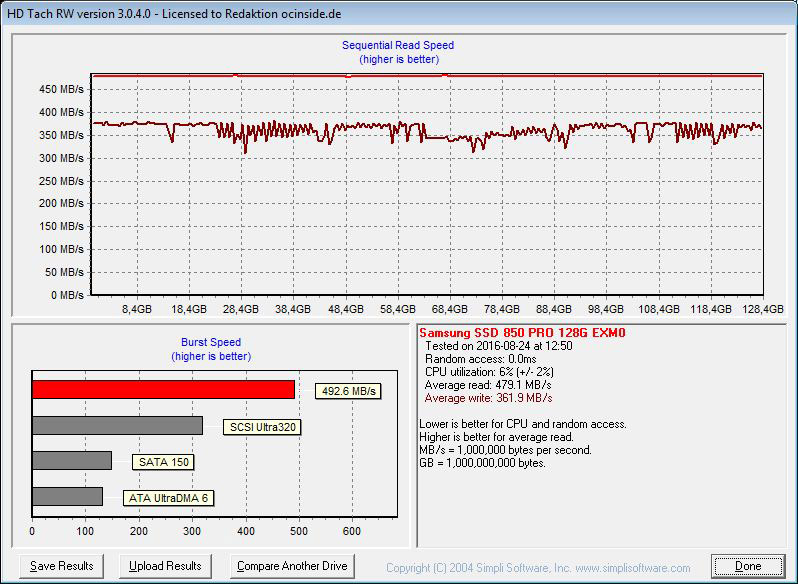
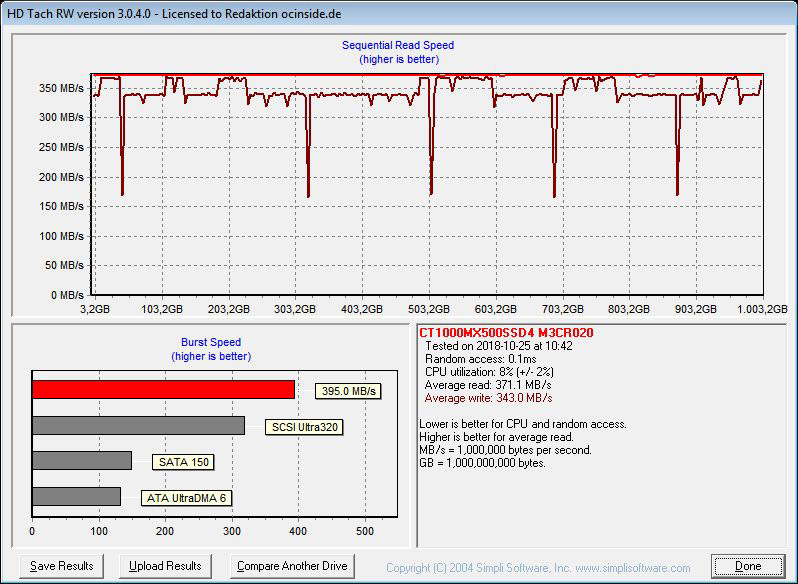
With HD Tach one can measure the gradient of the performance, but the SSD transfer is not comparable with a conventional HDD. New logical NAND cell access of the SSD controller results like some other equal designed SSDs in varying values with the latest HD Tach Version 3.0.4.0 version, which is designed for hard disk drives.
HD Tach shows with the Crucial MX500 1000GB M.2 SSD in AHCI mode a usual continuous transfer image with a low access time of 0.1ms during the read operations. During the write operations you can see clear peaks.
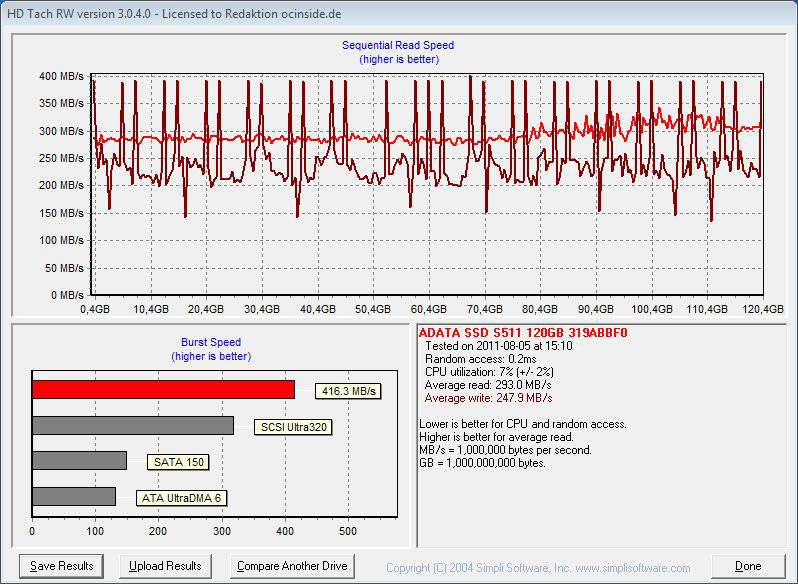
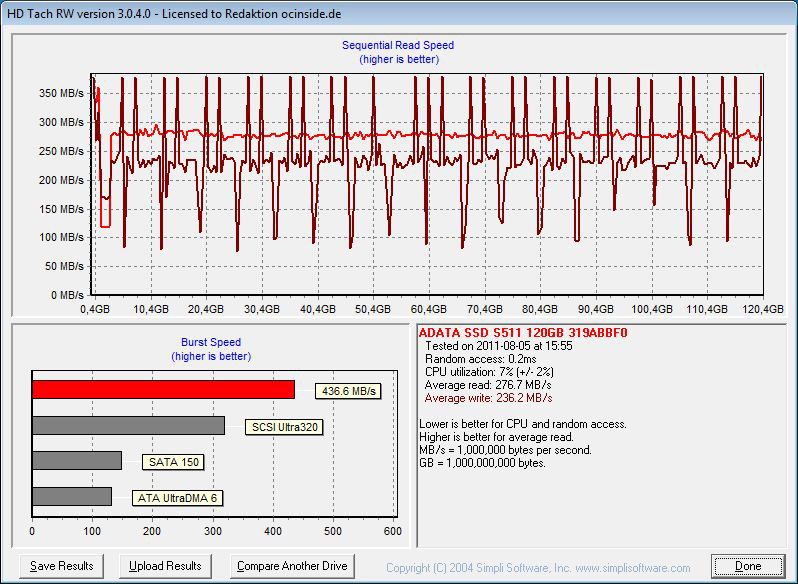
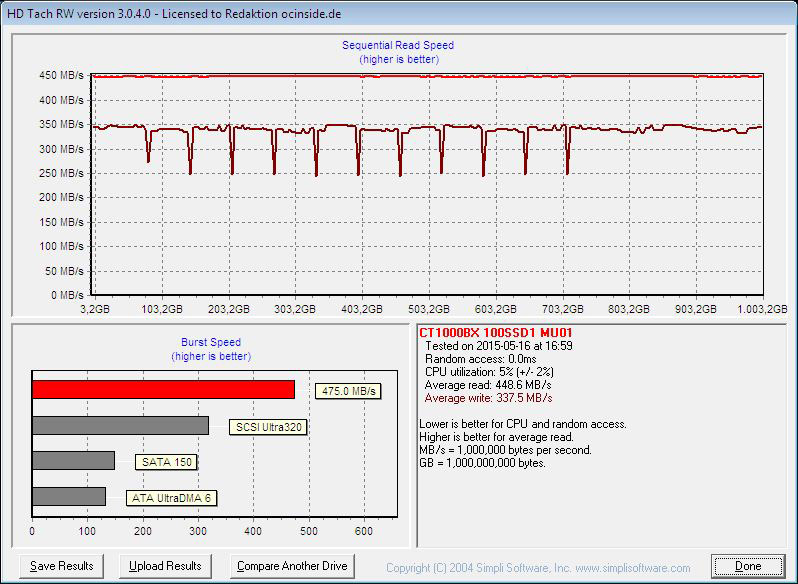
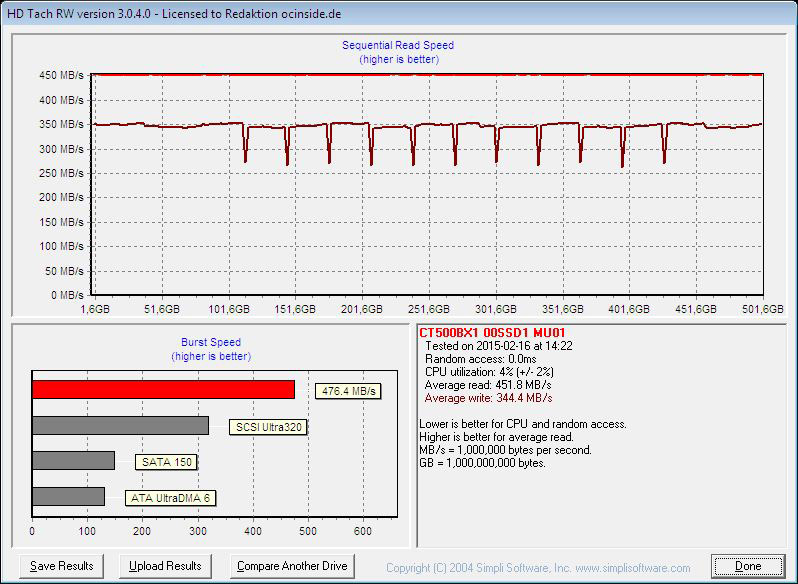
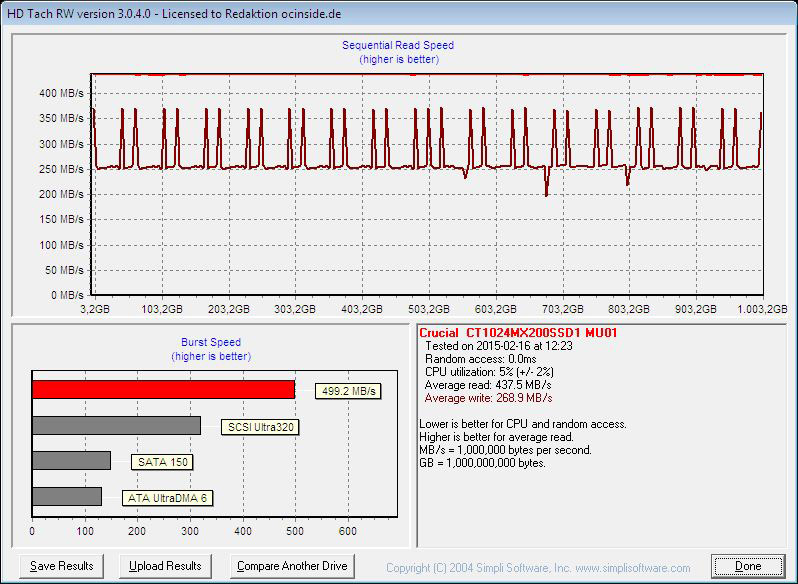
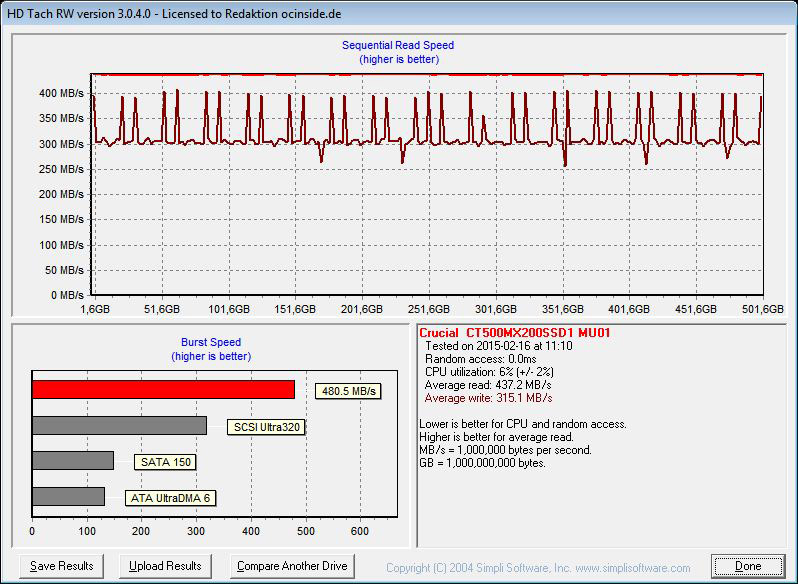
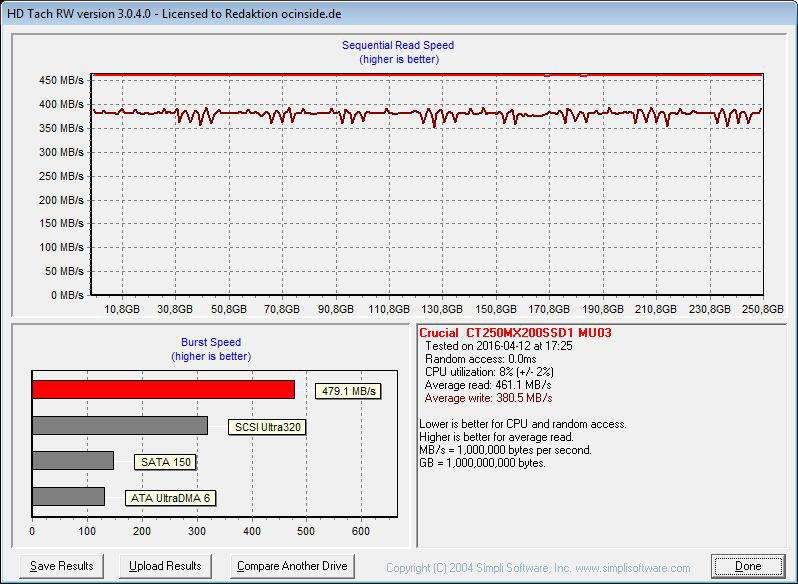
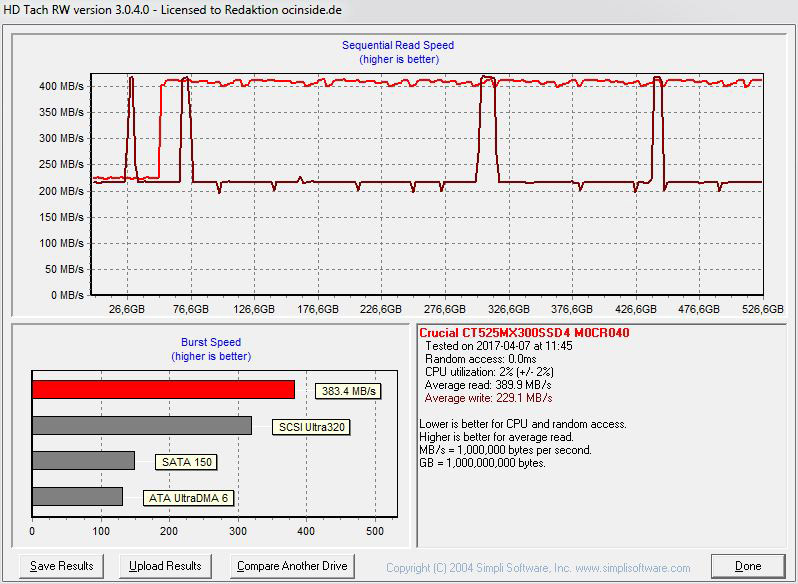
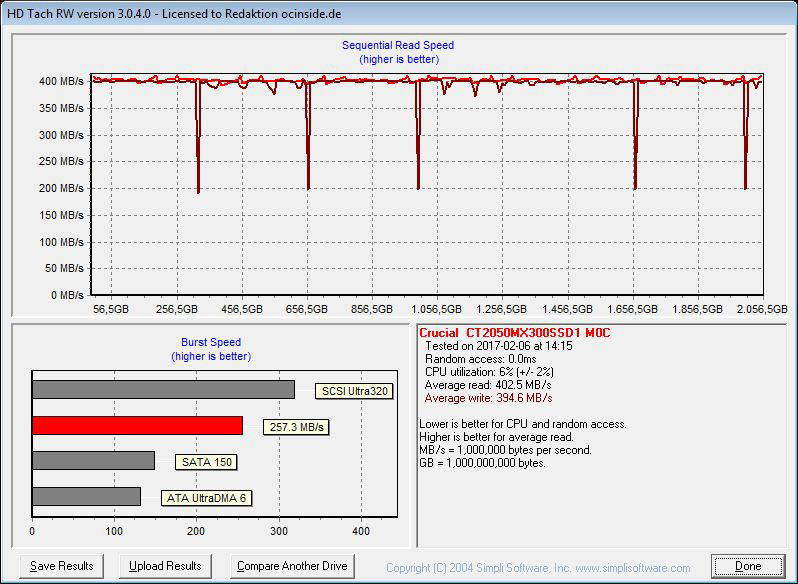
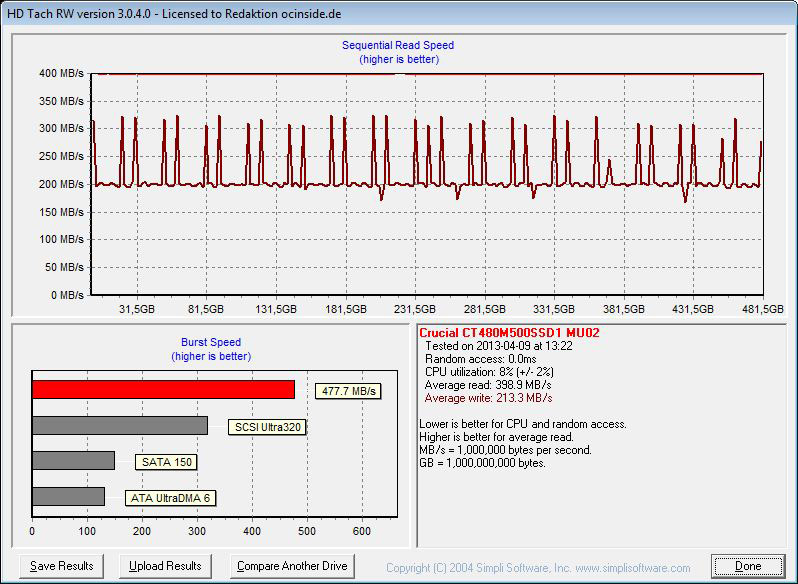
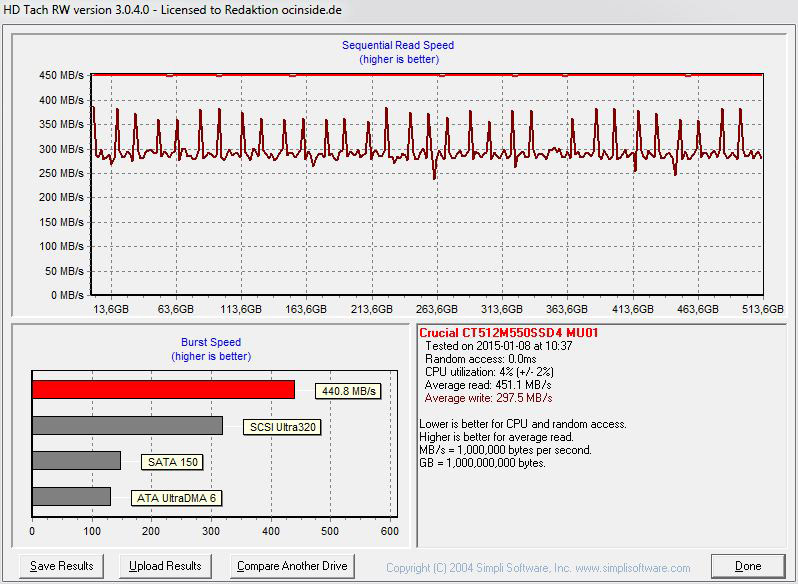
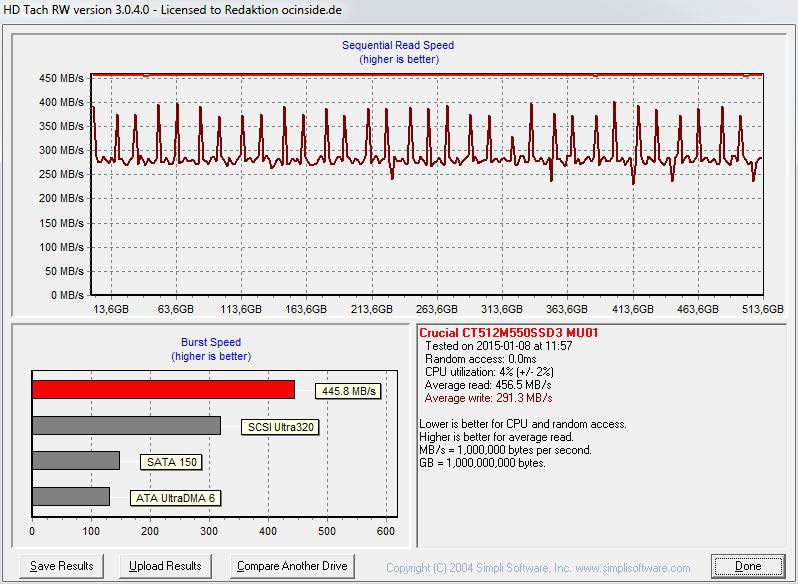
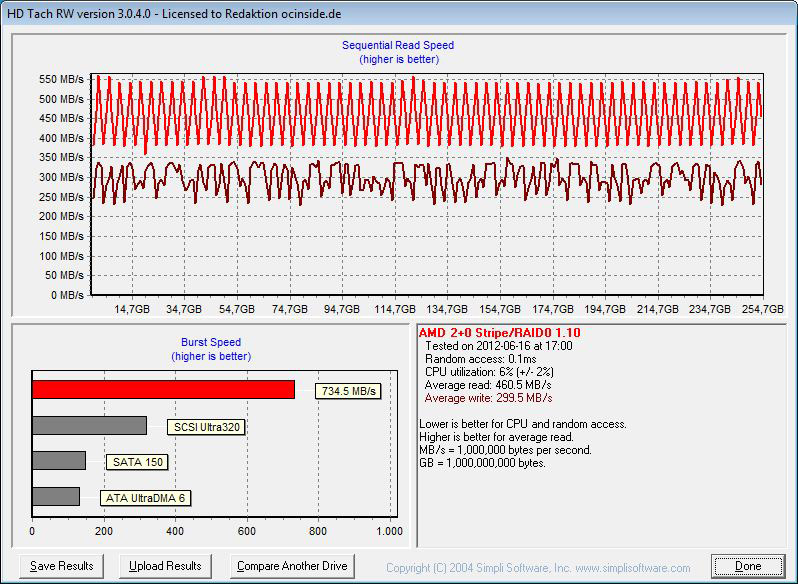
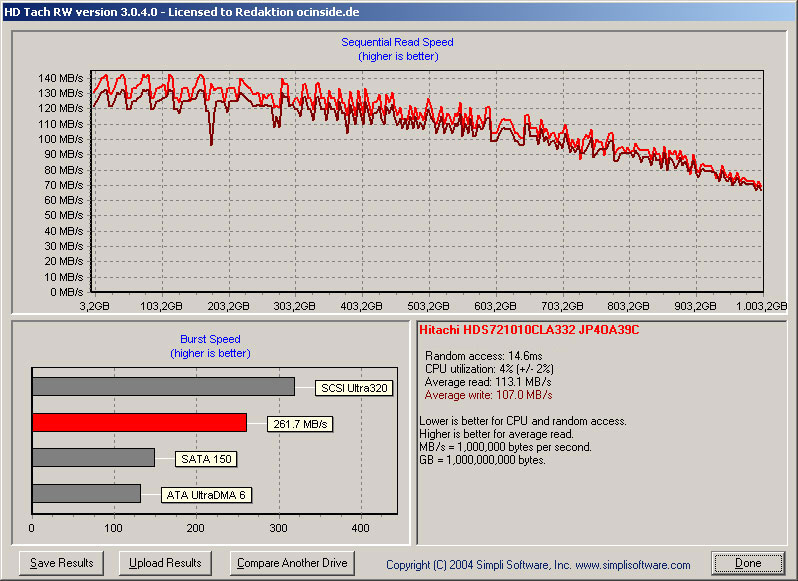
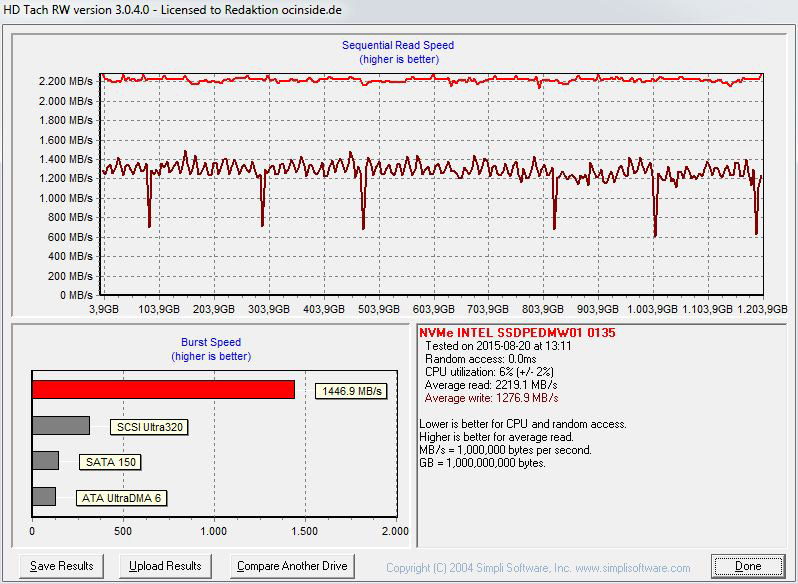
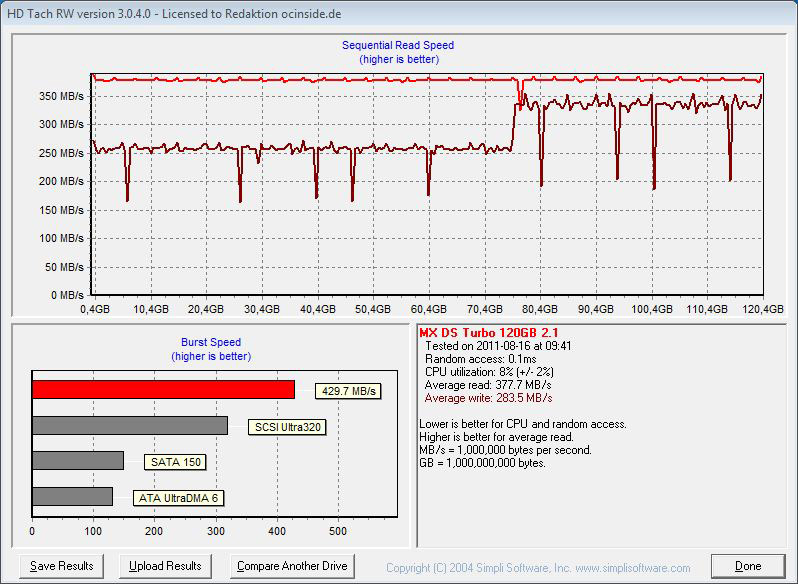
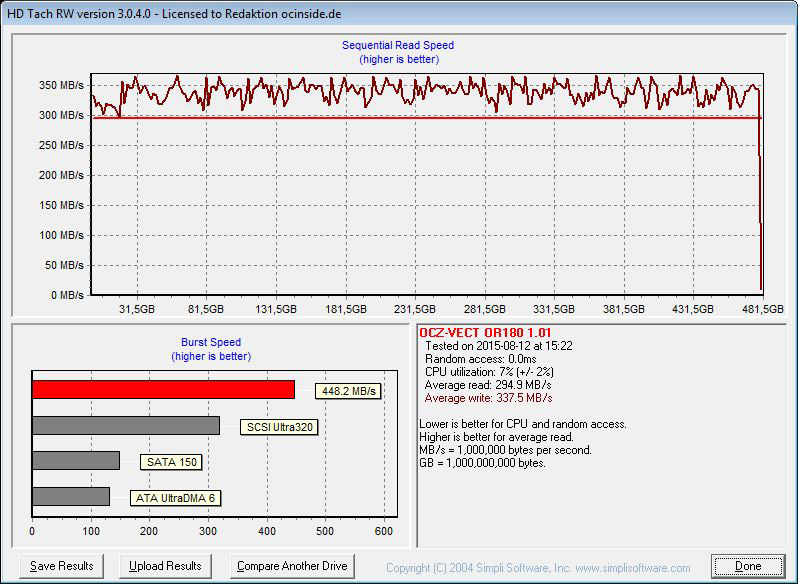
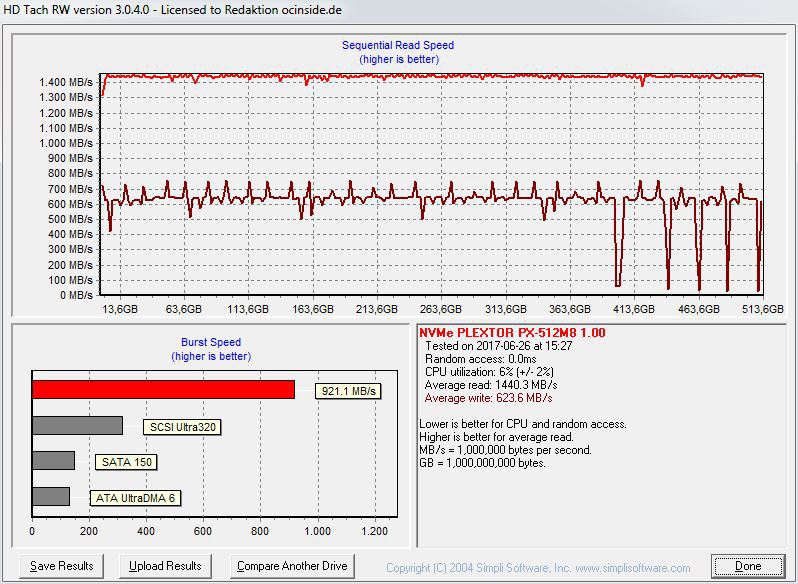
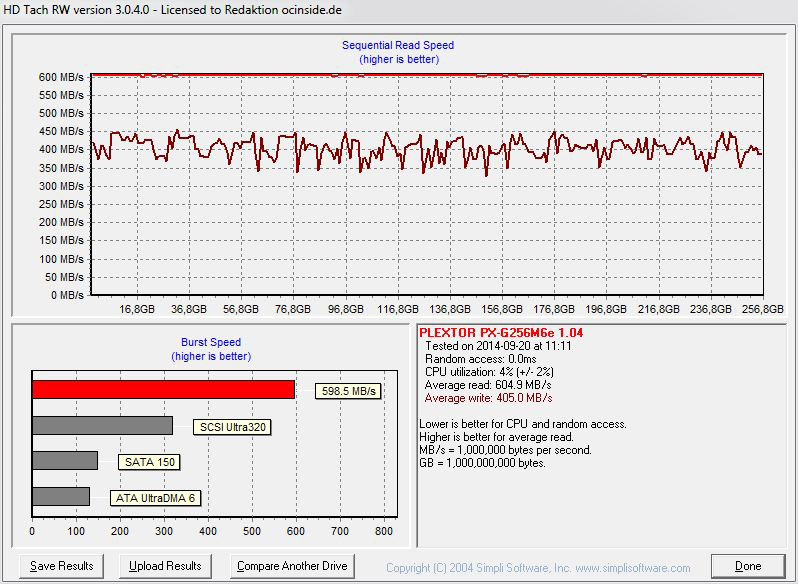
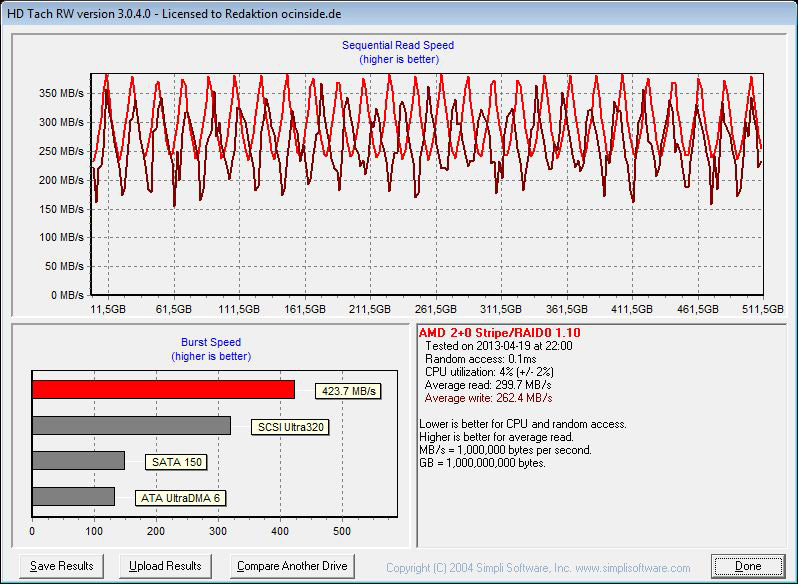
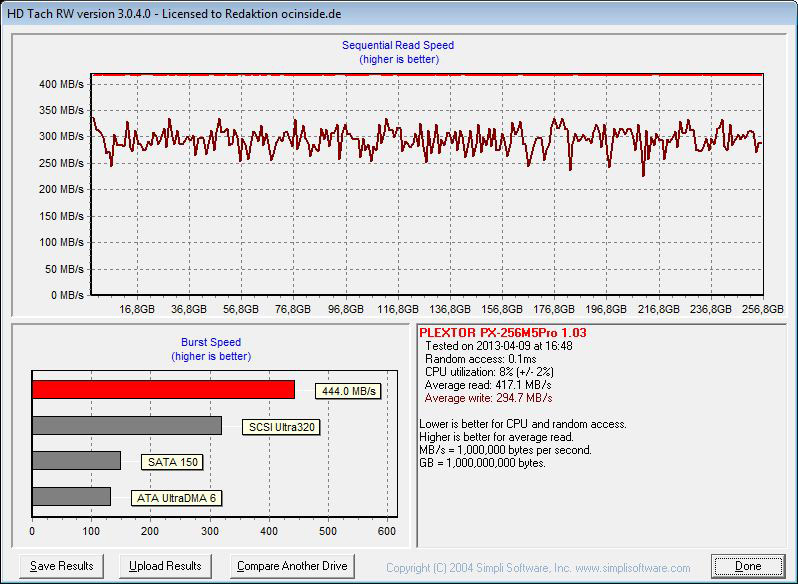
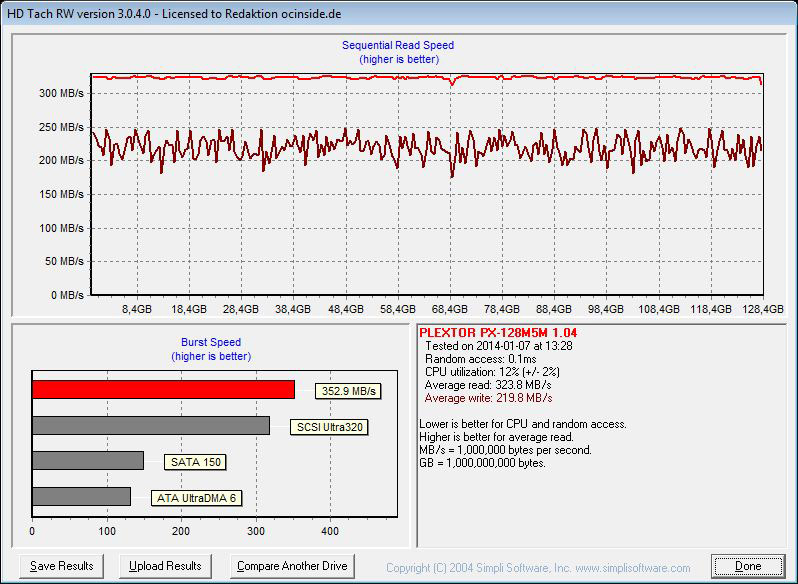
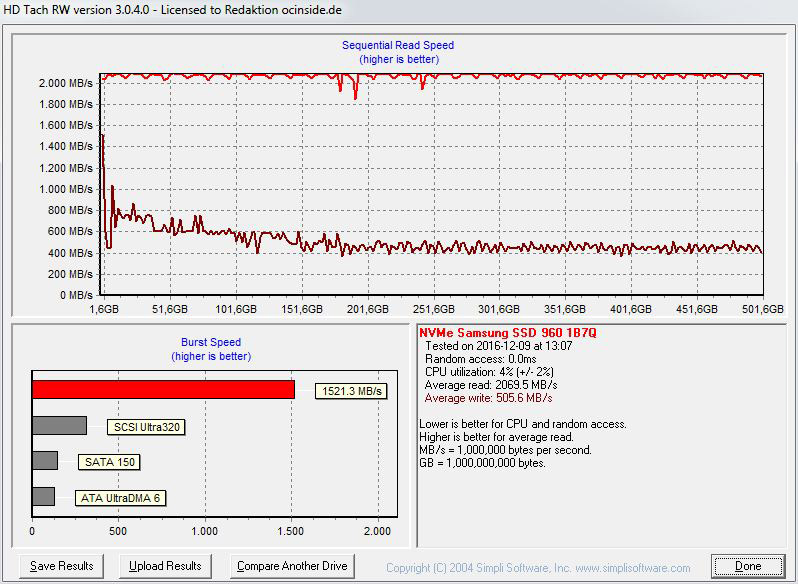
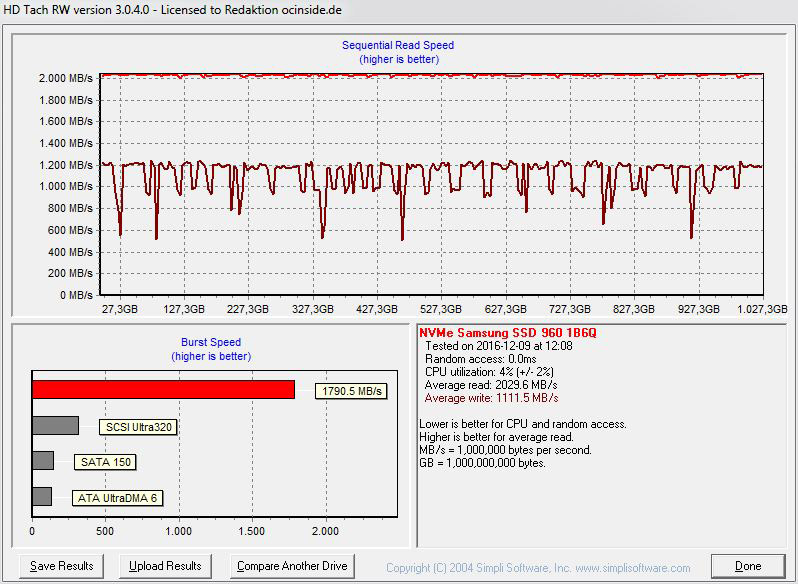
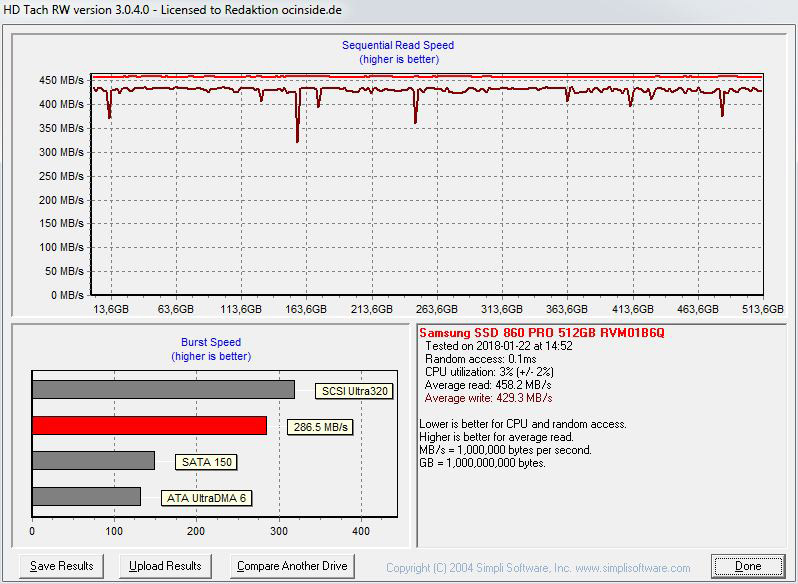
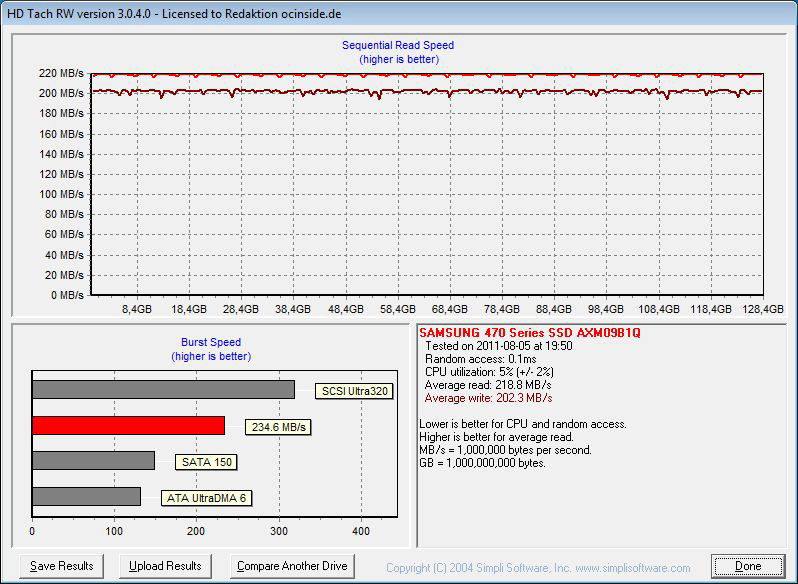
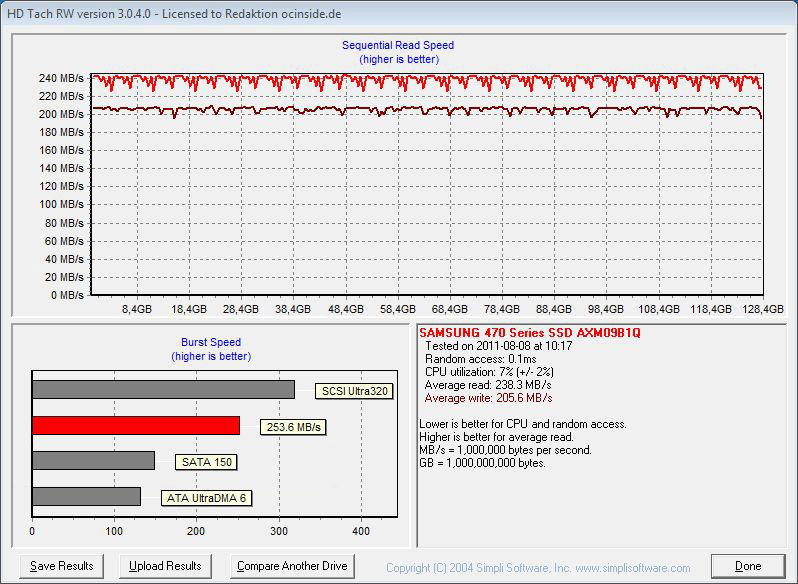
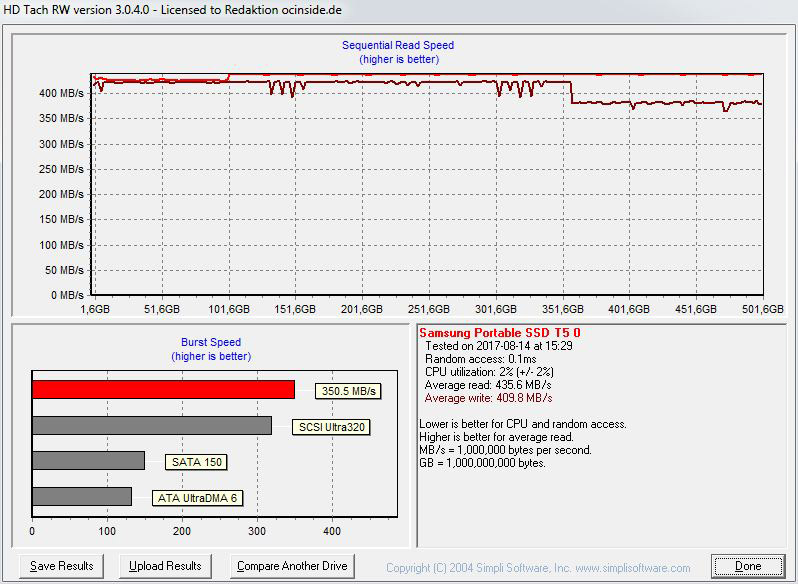
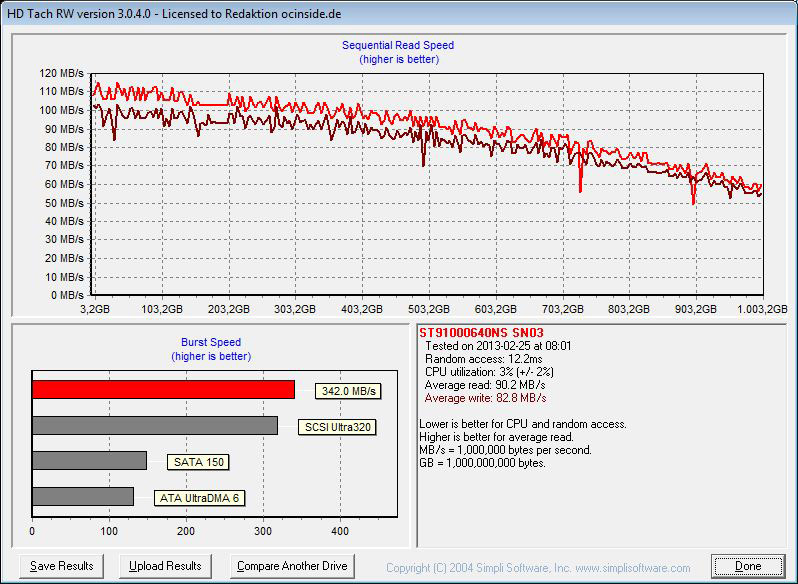
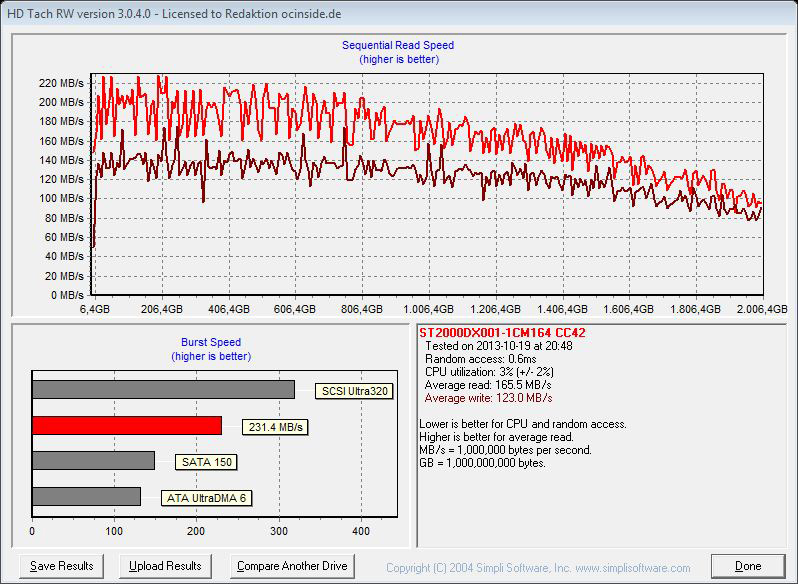
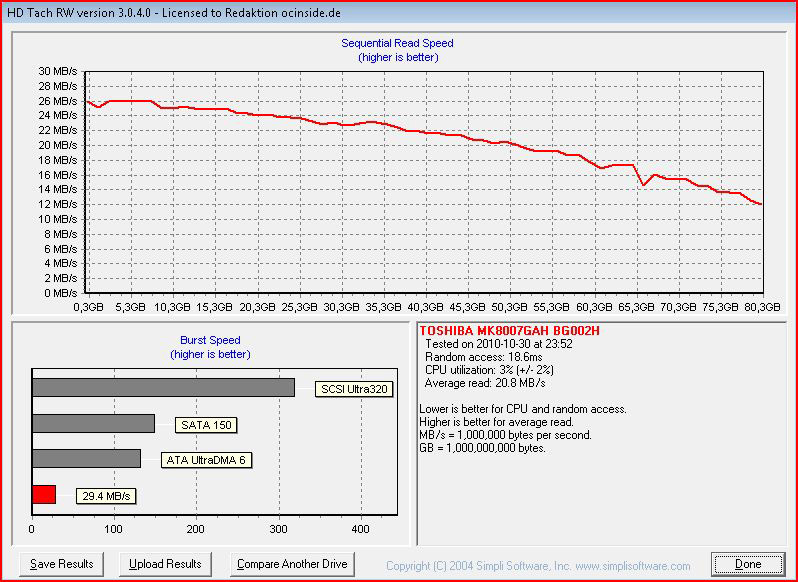
For comparison. you can move the mouse pointer over the following drives to see their respective benchmark results:
Crucial MX500 1TB M.2 2.5″ SSD, Crucial MX500 1TB 2.5″ SSD, ADATA S511 120GB SSD, ADATA S511 120GB SSD, Crucial BX300 480GB 2.5″ SSD, Crucial BX200 960GB 2.5″ SSD, Crucial BX200 480GB 2.5″ SSD, Crucial BX100 1TB 2.5″ SSD, Crucial BX100 500GB 2.5″ SSD, Crucial MX100 512GB 2.5″ SSD, Crucial MX200 1TB 2.5″ SSD, Crucial MX200 500GB 2.5″ SSD, Crucial MX200 500GB M.2 SSD, Crucial MX200 500GB mSATA SSD, Crucial MX200 250GB 2.5″ SSD, 2x Crucial MX200 250GB 2.5″ SSDs RAID0, 3x Crucial MX200 250GB 2.5″ SSDs RAID0, 4x Crucial MX200 250GB 2.5″ SSDs RAID0, Crucial MX300 750GB 2.5″ SSD, Crucial MX300 525GB M.2 SSD an SATA3 AHCI, Crucial MX300 2050GB 2.5″ SSD, Crucial M500 480GB 2.5″ SSD, Crucial M550 512GB 2.5″ SSD, Crucial M550 512GB M.2 SSD, Crucial M550 512GB mSATA SSD, 2x Crucial m4 128GB 2.5″ SSD an SATA3 RAID, Crucial m4 128GB 2.5″ SSD, Crucial m4 128GB 2.5″ SSD an SATA3, Crucial m4 256GB 2.5″ SSD FW 000F, Crucial m4 256GB 2.5″ SSD FW 0309, Crucial m4 256GB 2.5″ SSD FW 0002, Crucial m4 256GB SSD FW 0309 an SATA3 IDE, Crucial m4 256GB 2.5″ SSD FW 0002 an SATA3, Crucial C300 64GB 1.8″ SSD an SATA3, Crucial RealSSD C300 256GB 2.5″ SSD an SATA3, Crucial RealSSD C300 256GB 2.5″ SSD an SATA2, Hitachi 7K1000.C 1TB HDD, Intel SSD 750 1200GB PCIe Karte Gen3 x4, Intel 600p 512GB M.2 NVMe SSD an SATA3 AHCI, MX-DS Fusion 60GB SSD SATA3 IDE, MX-DS Fusion 60GB SSD SATA3 IDE, MX-DS Turbo 120GB SSD, OCZ Agility 128GB SSD, OCZ Vector 180 480GB 2.5″ SSD, Plextor M8SeGN 512GB M.2 NVMe SSD, Plextor M6e 256GB M.2 SSD PCIe AHCI, 2x Plextor M5 Pro Xtreme 256GB 2.5″ SSD an SATA3 RAID0, Plextor M5 Pro Xtreme 256GB 2.5″ SSD, Plextor M5M 128GB mSATA SSD, Samsung 960 Evo 500GB M.2 PCIe NVMe Gen3 x4 SSD, Samsung 960 Pro 1TB M.2 PCIe NVMe Gen3 x4 SSD, Samsung SSD 860 Pro 512 GB SSD an Intel SATA3 AHCI, Samsung SSD 860 Evo 500 GB SSD an Intel SATA3 AHCI, Samsung Series470 128GB SSD AHCI, Samsung 470 128GB SSD Legacy IDE, Samsung 850 Pro 128GB 2.5″ SSD, Samsung T5 Portable 500GB USB 3.1 SSD, Seagate Constellation.2 1TB 2.5″ HDD an SATA3, Seagate ST2000DX001 2TB 3.5″ SSHD, Toshiba MK8007GAH 1.8″ HDD.
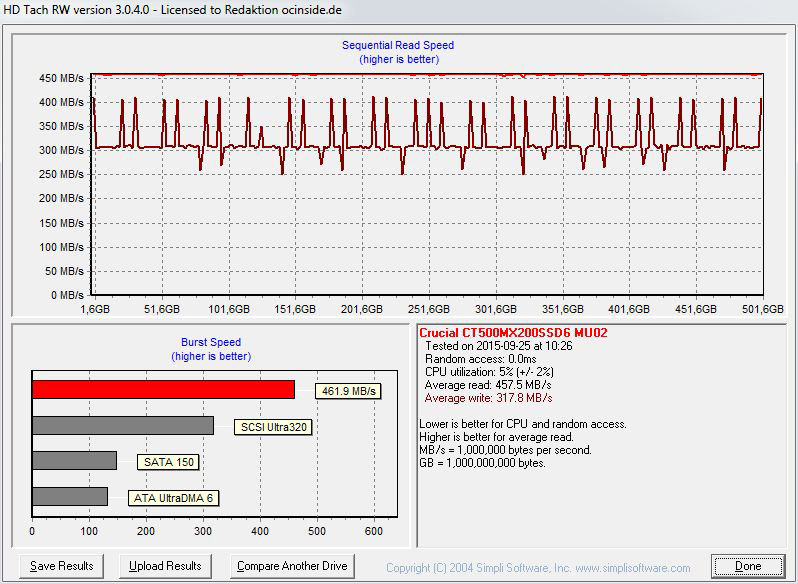
Here is a screenshot of the HD Tach benchmark values:
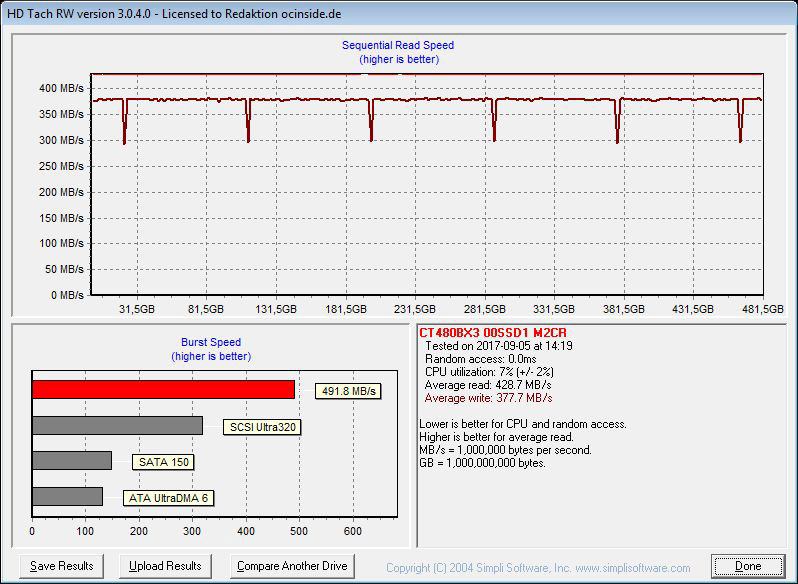
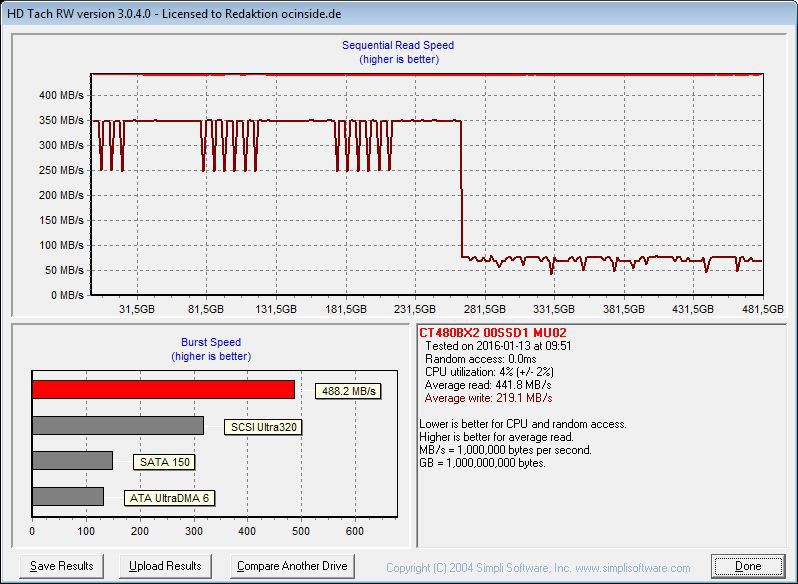
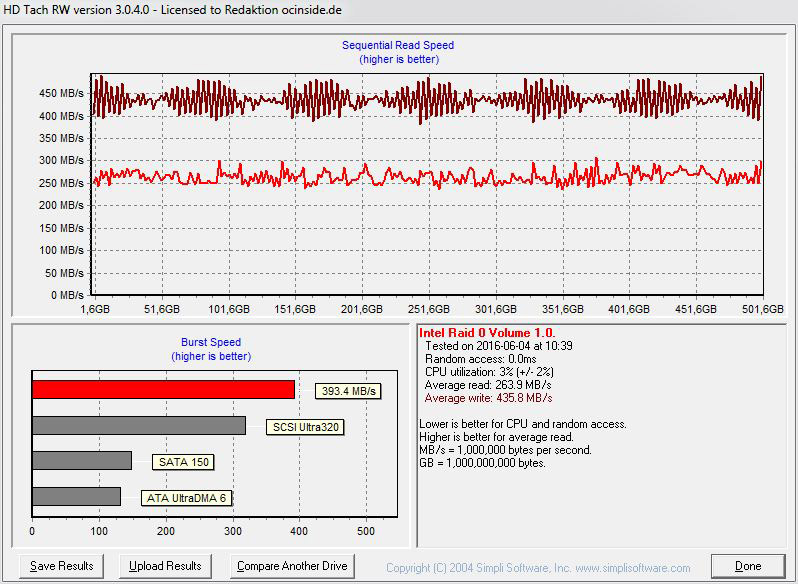
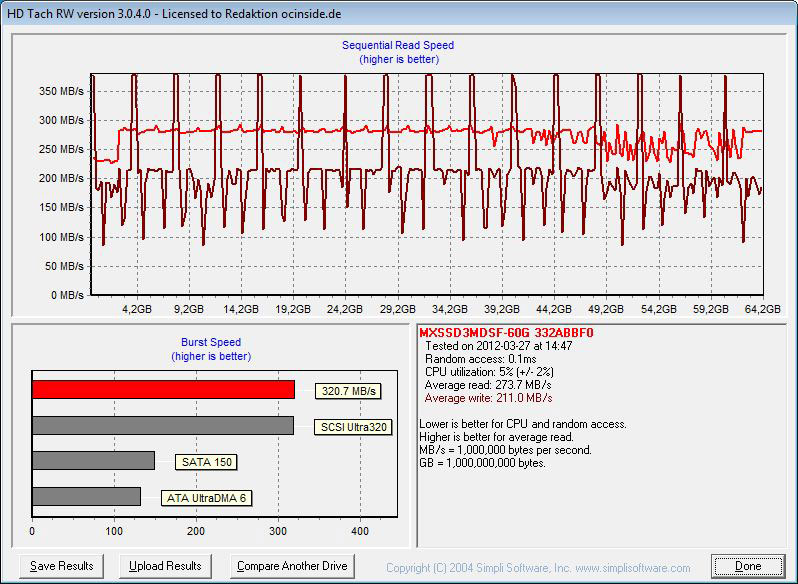
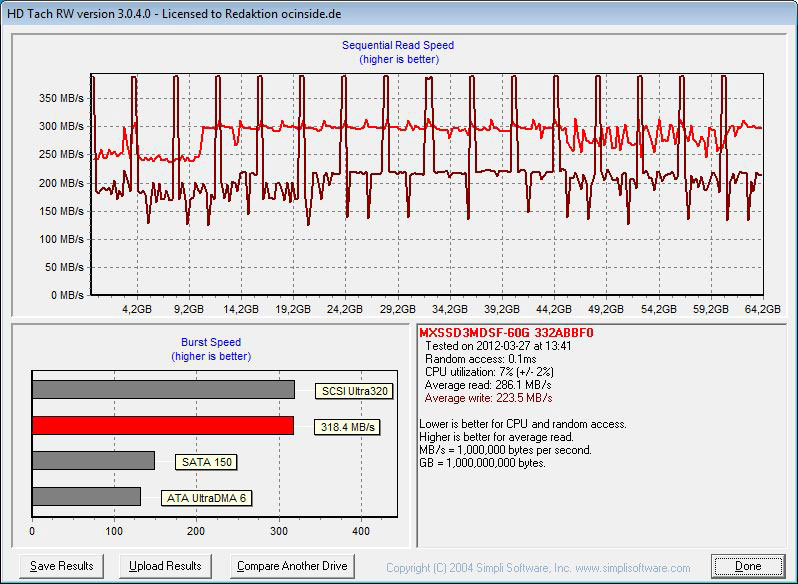
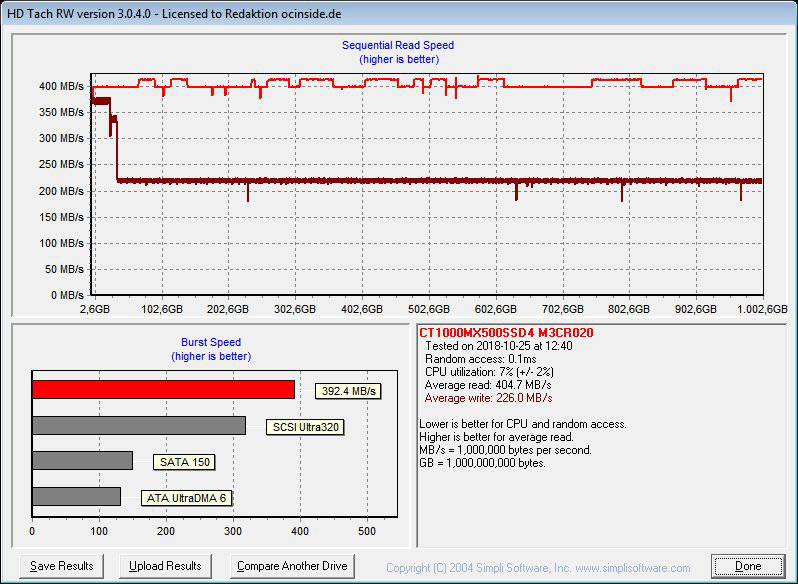
In order to see how the new 64 Layer 3D TLC NAND Flash behaves with a larger file transfer, we have additionally started the very time-consuming Full Bench. In contrast to the 2.5″ version, you can see that the M.2 starts with a similar reading performance of approx. 370 MB/s and then has a much stronger performance drop with approx. 220 MB/s (instead of 350 MB/s) at longer write rates from approx. 24GB data transfer. So the M.2 SSD is clearly less successful in this benchmark.
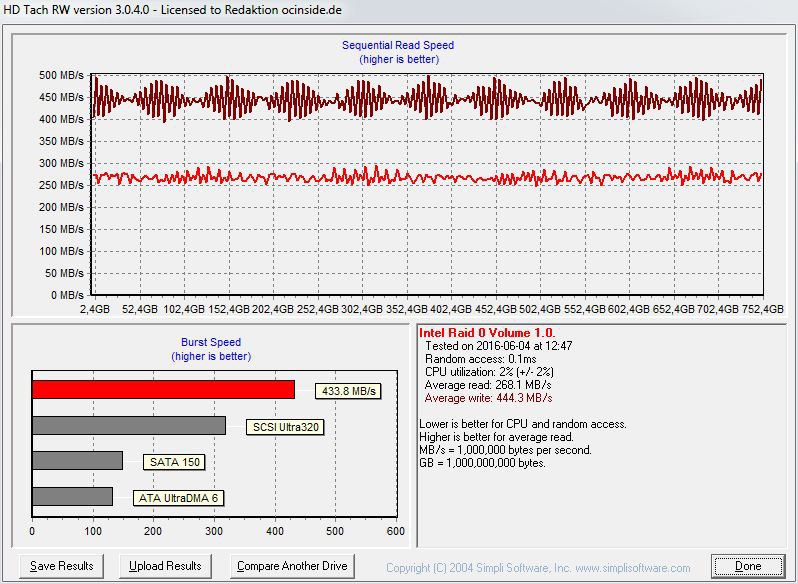
Here’s a comparison of the HD Tach benchmark values that are gradually being expanded with new drives:
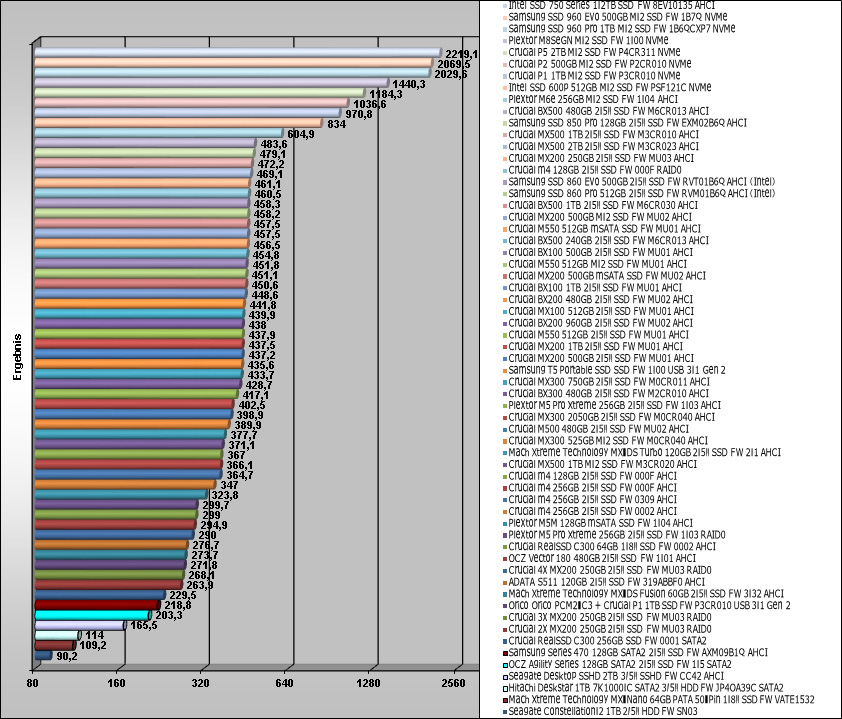
And here’s an excerpt of the latest HD Tach benchmark values, which will be gradually replaced with the latest drives:
SiSoftware Sandra benchmark results
Of course, SiSoftware Sandra benchmark should not be missing in this test series. SiSoftware offers with their SiSoft Sandra program a very comprehensive tool, which contains a lot of tools to get very reliable test results of all hardware components.
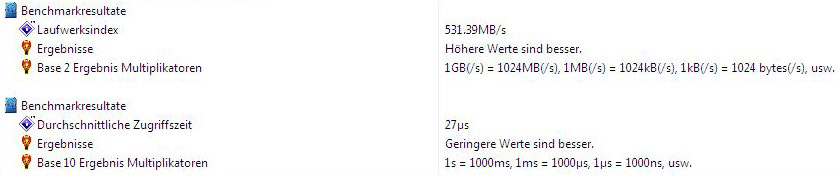
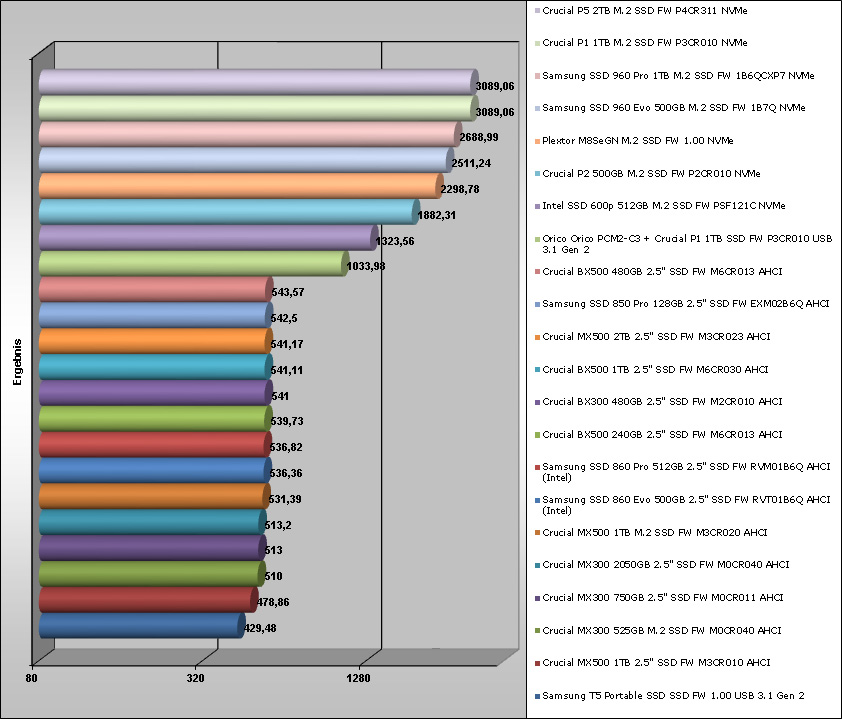
The average access time of the Crucial MX500 1 TB M.2 SSD was extremely low for SiSoftware Sandra with 27us and the drive index of 531.39 MB/s is a good value for a SATA SSD.
Here is a screenshot of the SiSoftware Sandra benchmark read values (M.2 SATA3 AHCI):
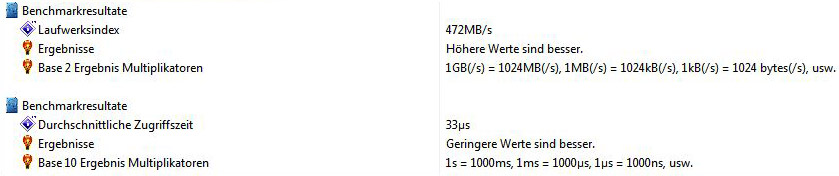
With the SiSoftware Sandra write performance measurement, the average access time of the Crucial MX500 1TB M.2 SSD was also extremely low at 33us and the drive index reaches a good 472 MB/s after all.
Here is a screenshot of the SiSoftware Sandra benchmark write values (M.2 SATA3 AHCI):
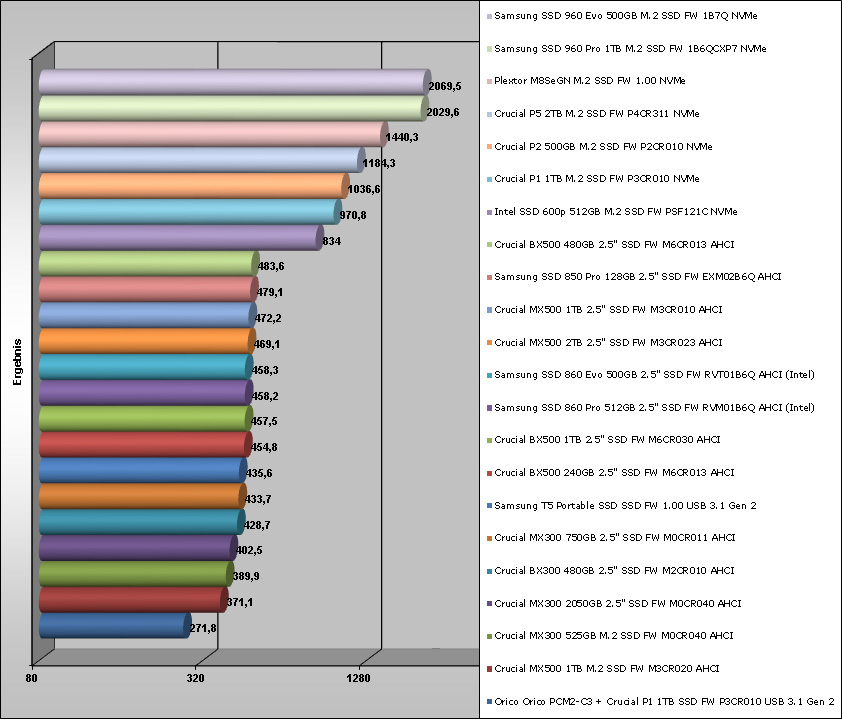
Here is a comparison of the SiSoftware Sandra benchmark values, which are getting updated with soon coming drives:
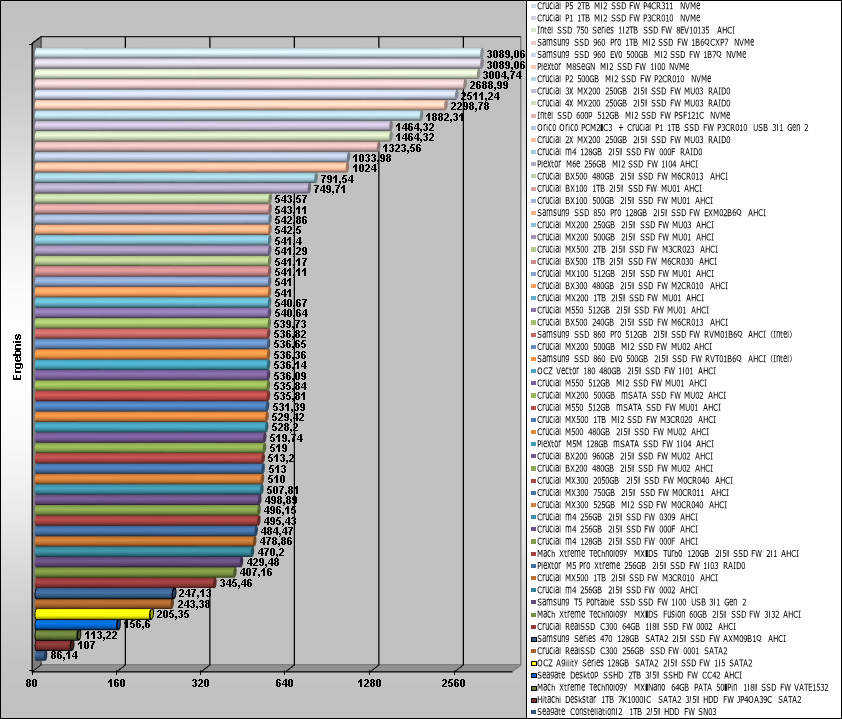
And here’s an extract of the latest SiSoftware Sandra benchmark values, which will gradually be replaced with the latest drives:
Crucial MX500 1 TB Result and general impression …